Bika Dashboard is an intelligent platform for data visualization and analysis. It offers comprehensive data analysis solutions through modular components, enabling multi-dimensional data insights, real-time business monitoring, dynamic interaction analysis, and professional - grade dashboards.
Operating Instructions
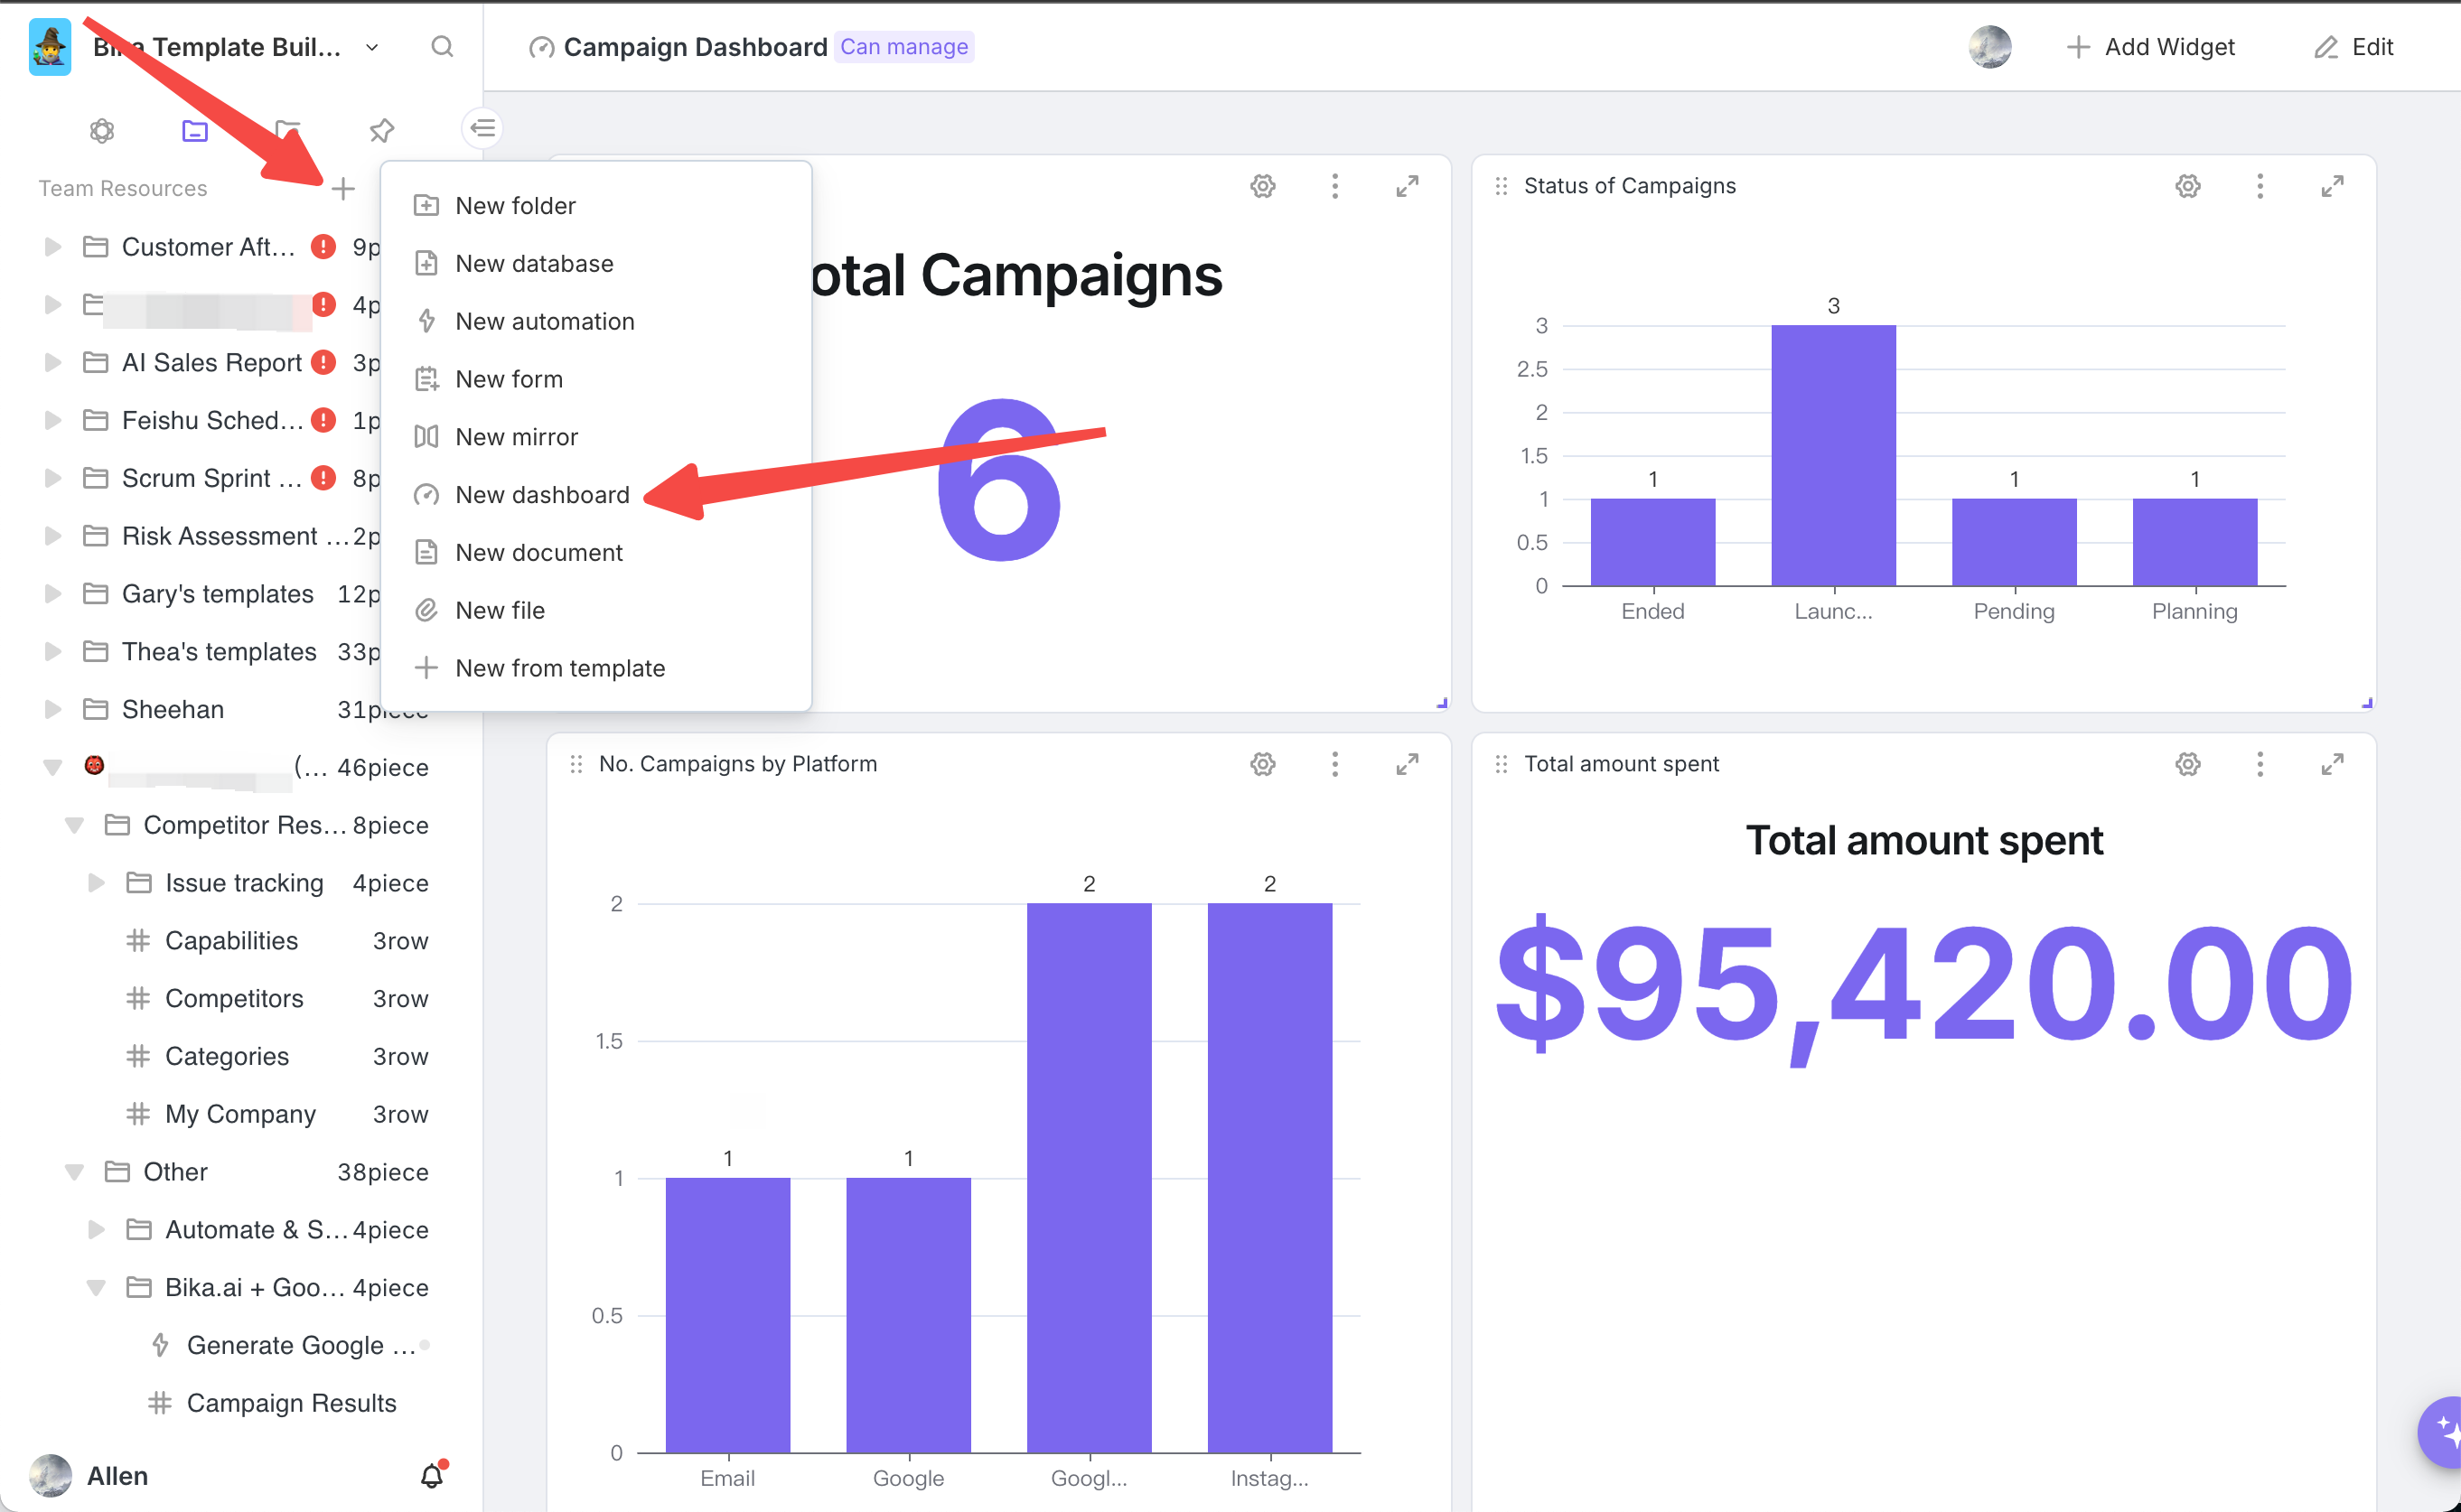
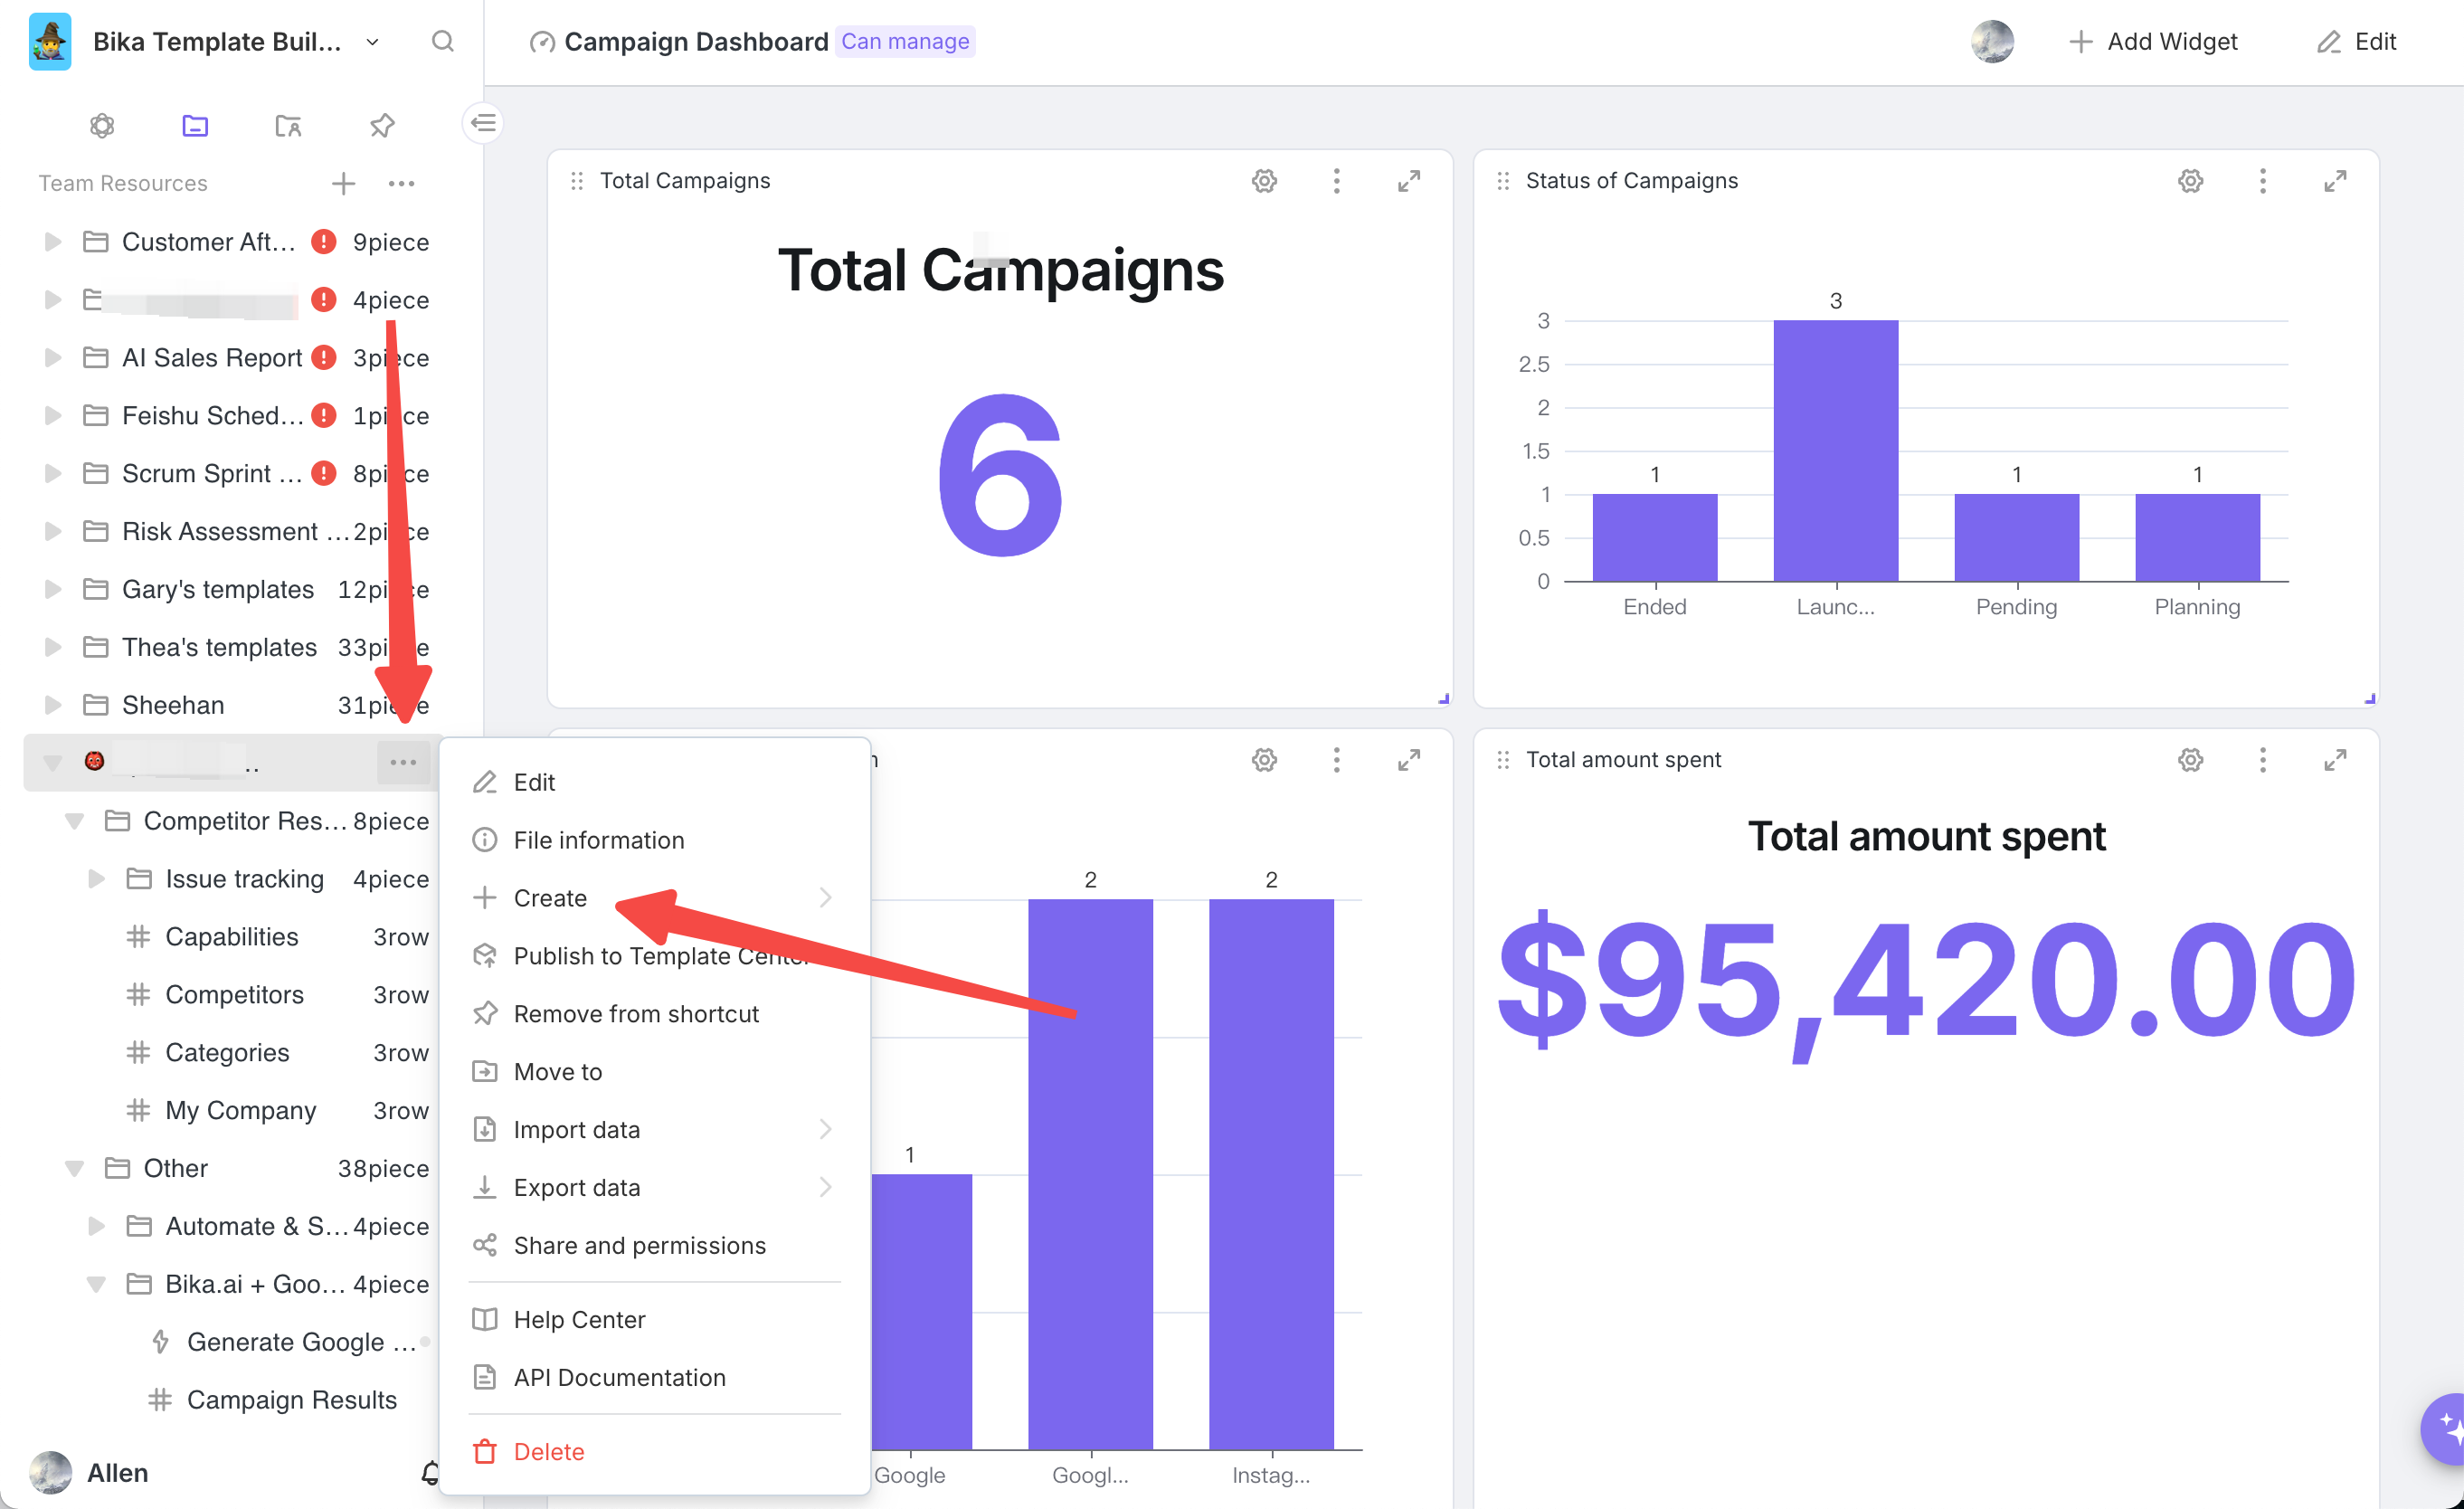
Creating a New Dashboard
Click "+ " above the workspace directory and select "New Dashboard". You can also click "..." next to any folder to create a new dashboard.
Adjusting Components
Resizing Components:After adding a component, position your mouse at its lower - right corner and drag to resize.
Repositioning Components:Place your mouse at the component's upper - left corner, hold and drag the mouse to reposition.
Reconfiguring Components:Click the "Settings" icon at the component's upper - right corner, then choose "widget setting" in the menu to reconfigure.
Expanding for Viewing:Click the "Expand to View" button at the dashboard's upper - right corner to switch to full - screen pop - up mode, ideal for presentations.
Assortment planning is the process of selecting the product assortment to be sold during a specific time period and deciding how to allocate these products between different locations or sales channels to maximize profit. This template includes two databases, "Products" and "Manufacturer", which you can expand and adjust to meet specific business needs.
Based on your To facilitate the work of finance and administrative staff, the system will automatically remind company colleagues to collect invoices and submit applications on a regular basis according to your settings. In this way, colleagues can quickly take photos and upload invoices, helping finance and administrative staff to quickly collate invoice data for subsequent reimbursement or tax filing processes., regular automatic reminders for invoice information collation and quick photo upload of invoices by the user help users to quickly collate invoice data for subsequent reimbursement or tax filing.
Effortlessly plan and track digital marketing initiatives with this template. Align goals with tasks, monitor progress, and use automation to send reports to Slack upon goal completion for seamless collaboration.
OKR (Objectives and Key Results) is a set of management tools and methods for clarifying and tracking goals and their completion. In 1999, OKR was promoted by Google and widely used by Facebook, LinkedIn and other companies. In 2014, OKR was introduced to China.
This template uses the financial recognition OCR of Baidu AI Cloud to automatically extract the key information from the invoice and support invoice verification. It helps enterprises or individuals reduce manual input, improve the efficiency of financial data management. Optimize the work process, reduce human errors, and improve data accuracy.