Bika
GuideDashboard

Introduction to Dashboard

Introduction to Dashboard

Introduction

Bika Dashboard is an intelligent platform for data visualization and analysis. It offers comprehensive data analysis solutions through modular components, enabling multi-dimensional data insights, real-time business monitoring, dynamic interaction analysis, and professional - grade dashboards.

Operating Instructions

Creating a New Dashboard

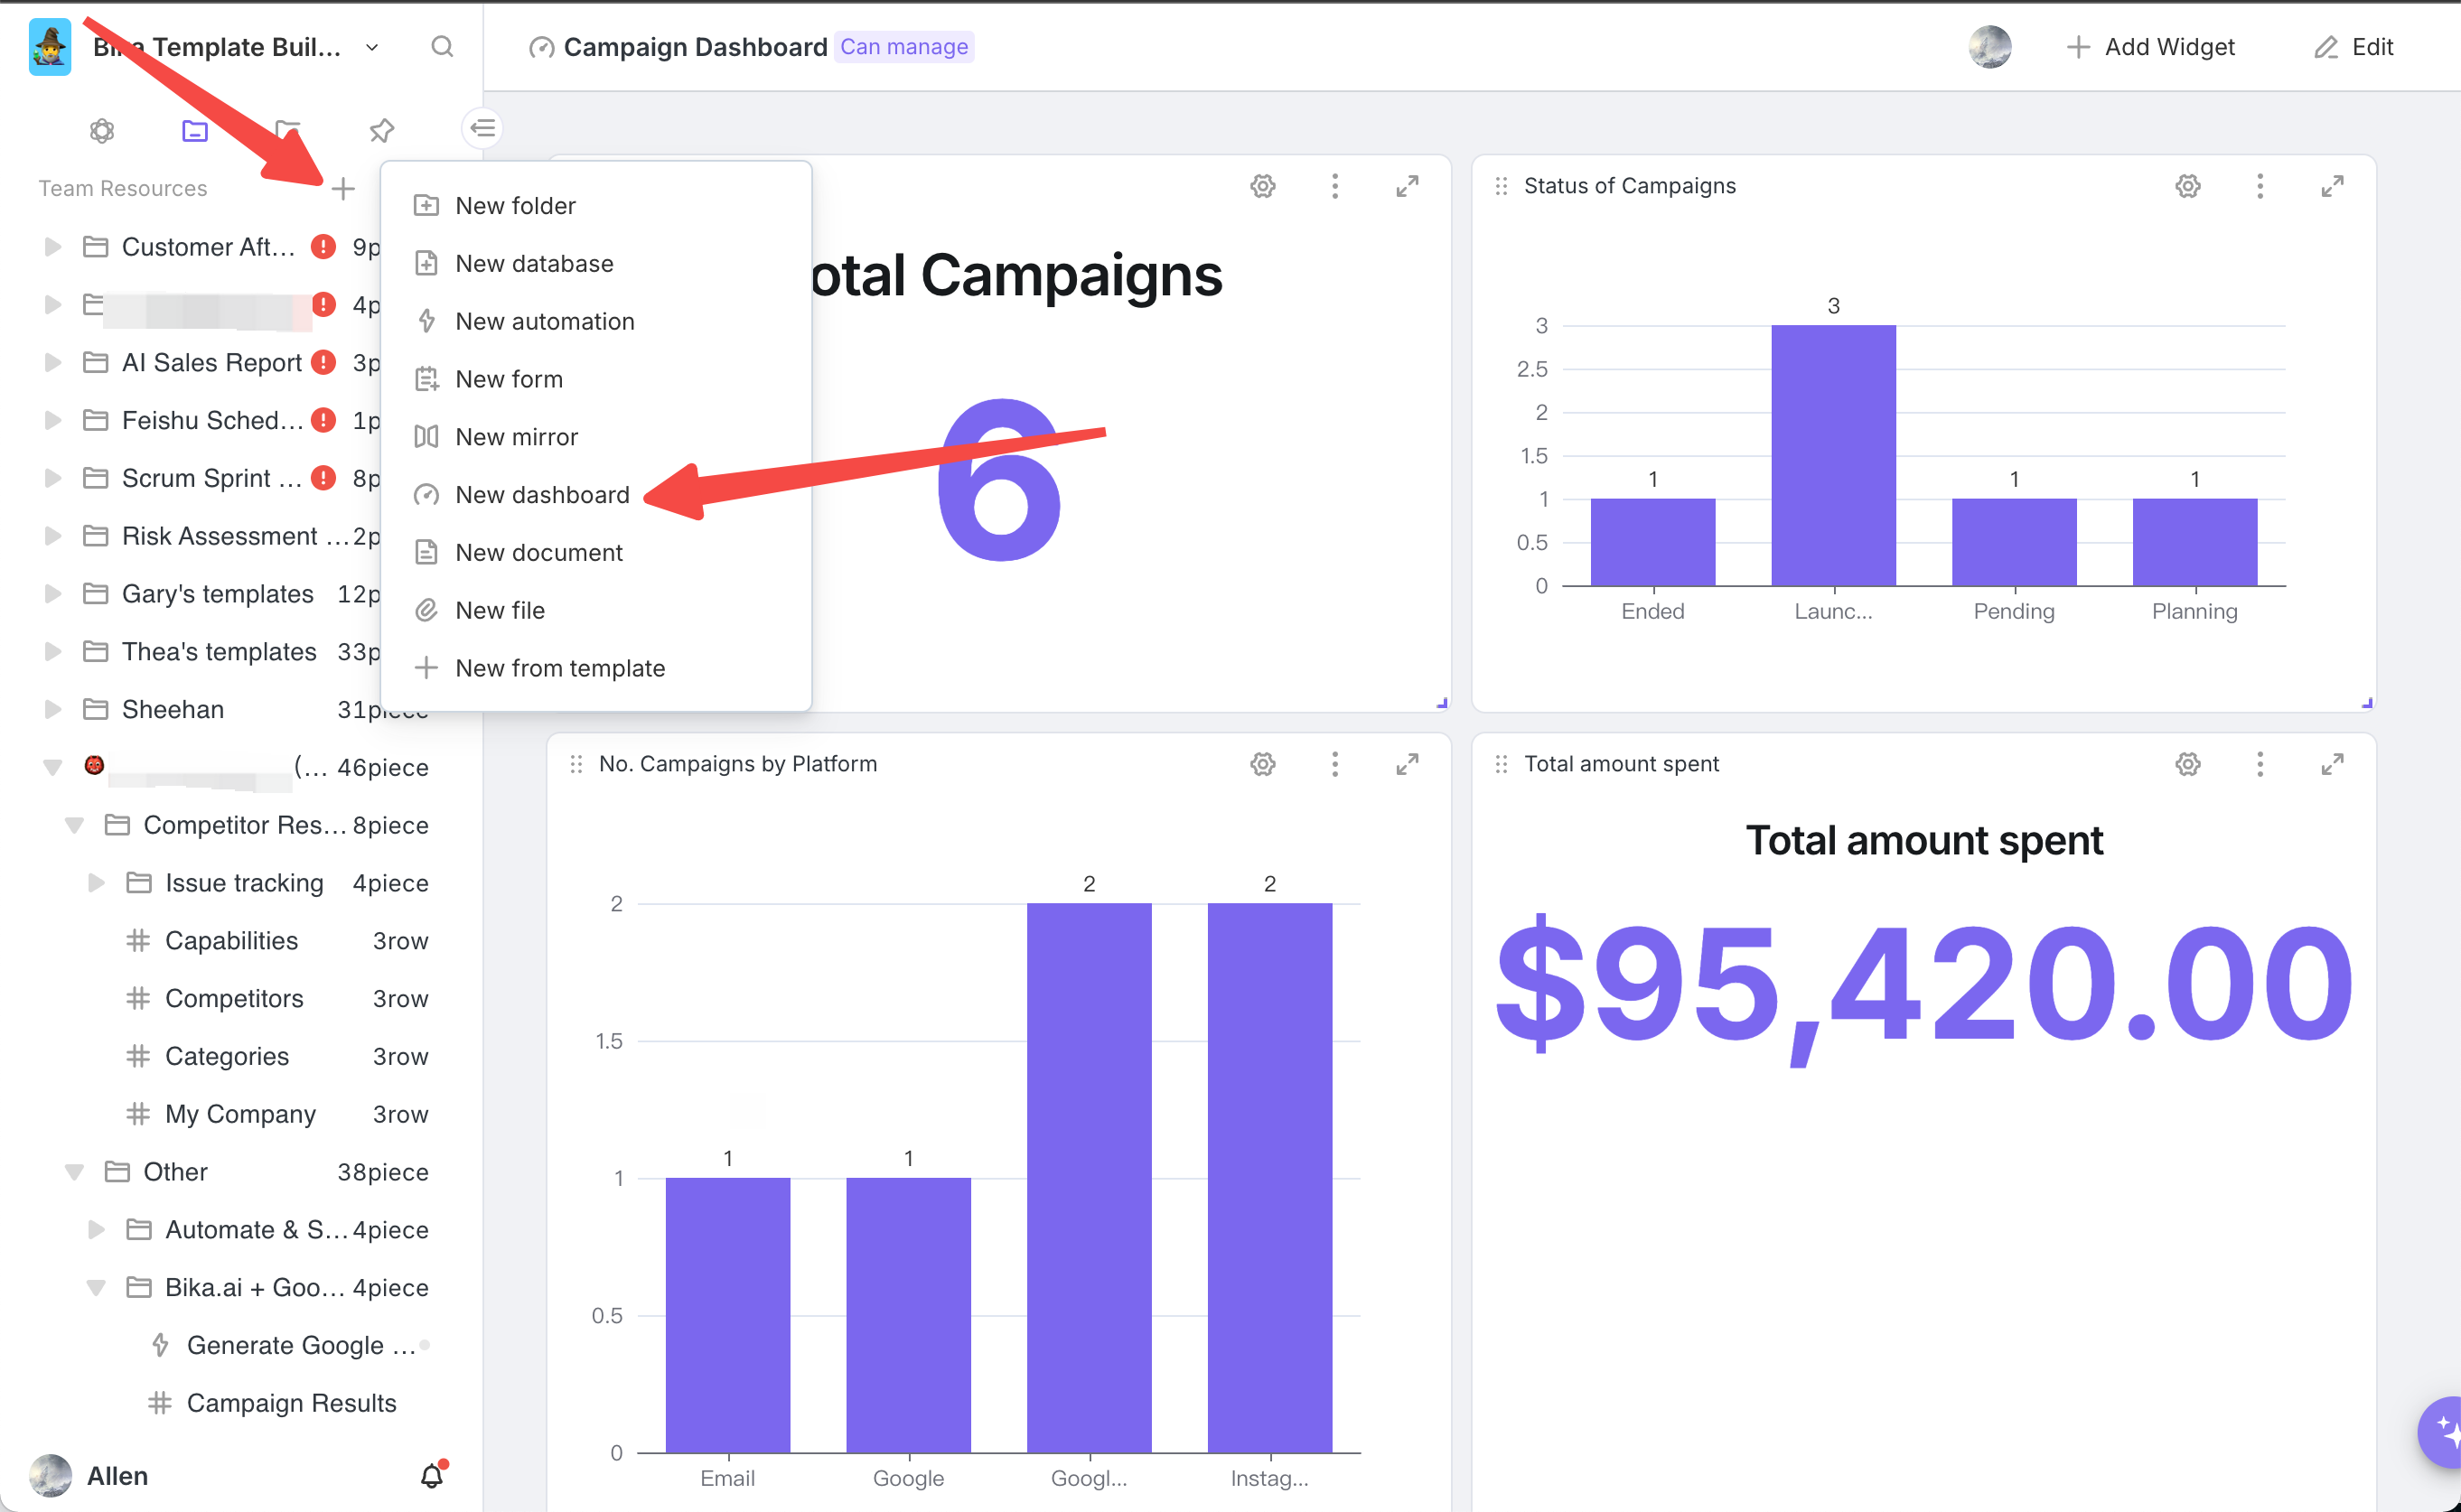
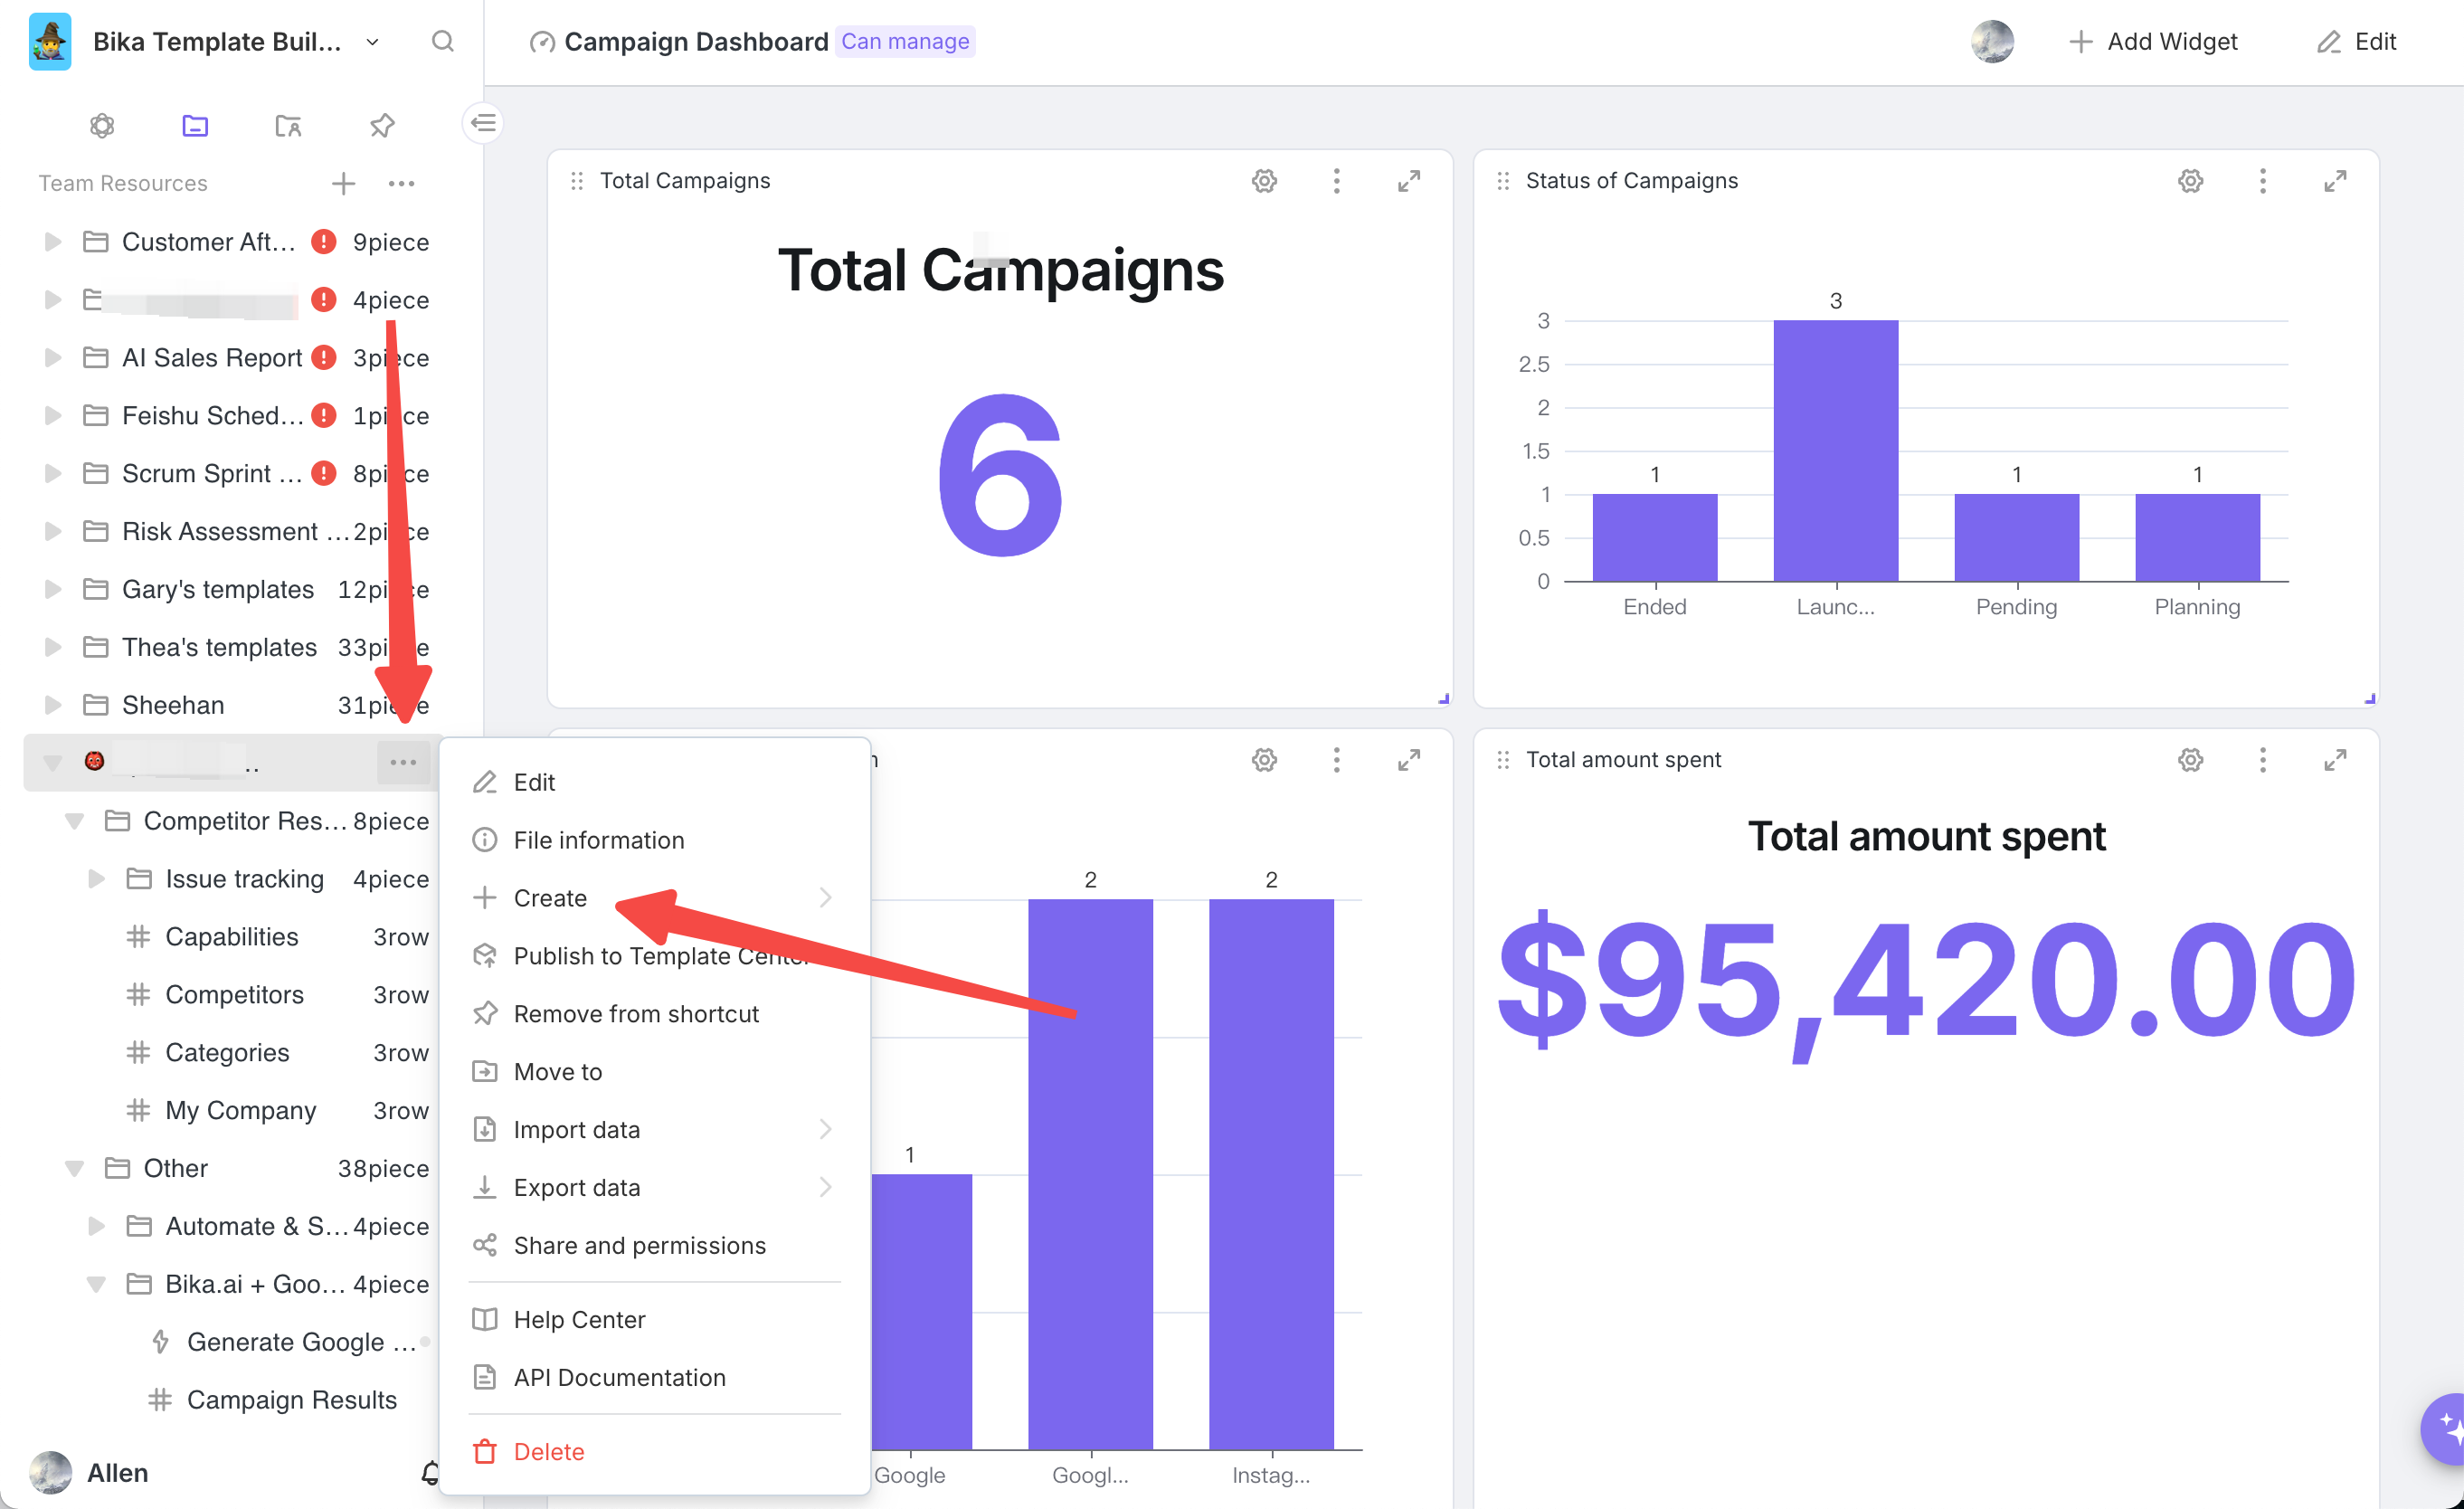
Click "+ " above the workspace directory and select "New Dashboard". You can also click "..." next to any folder to create a new dashboard.

Create new dashboard Dashboard creation interface

Adjusting Components

  1. Resizing Components:After adding a component, position your mouse at its lower - right corner and drag to resize.

    Resize dashboard component
  2. Repositioning Components:Place your mouse at the component's upper - left corner, hold and drag the mouse to reposition.

    Reposition dashboard component
  3. Reconfiguring Components:Click the "Settings" icon at the component's upper - right corner, then choose "widget setting" in the menu to reconfigure.

    Component settings icon Widget setting menu
  4. Expanding for Viewing:Click the "Expand to View" button at the dashboard's upper - right corner to switch to full - screen pop - up mode, ideal for presentations.

    Expand to view button Full screen dashboard view
Recommend AI Automation Templates
AI Automated Task Management
Helps teams efficiently manage weekly tasks. Through a series of automation tools, including task summaries, progress reminders, and personal summary reports, team members can promptly obtain task information and progress, thereby improving collaboration efficiency and work transparency. By using these automation features, teams can maintain efficient operations and ensure that each member has a clear understanding and sense of responsibility for their tasks.
ADDIE Instructional Design Model
Use the ADDIE Instructional Design Model as a practical instructional design template to manage your entire course development process. Plan and track e‑learning content development, instructor‑led training design, and training materials development for professional skills courses and employee training programs. This template helps instructional designers, training developers, and education project managers organize tasks, align learning objectives, and streamline course creation for any organization.
Eisenhower Matrix
Eisenhower Matrix
Boost your personal productivity and manage tasks efficiently with the Eisenhower Matrix. Automate task actions, track task status, and prioritize projects based on importance and urgency. Perfect for individuals and teams seeking smarter time management and actionable task insights.
Event contacts management
Easily manage event contacts, track professional connections, and build your own personal CRM with this event CRM template. Log contact details, meeting notes, follow-up reminders, and attendee information all in one place. Ideal for networking events, conferences, and long-term relationship management. Boost your efficiency with an intuitive contact tracker and event workflow system.
Investor deal flow
Investor deal flow
Streamline your investment tracking with Bika.ai’s Investor Deal Flow template. Manage prospective deals, company contacts, and transaction details efficiently through a centralized dashboard. Track deal pipelines, monitor deal progress, and analyze deal analytics to improve management efficiency and ensure timely decision-making. Ideal for sales teams, investment firms, entrepreneurs, and business development teams seeking a complete deal management solution.
Fully Automated Twitter Scheduler
Automate your Twitter (X) account with Bika.ai's AI-powered template. Schedule tweets, post automatically, and save time while keeping your account active 24/7. Perfect for social media managers, businesses, and influencers.