MCP Server Chart
A visualization mcp contains 25+ visual charts using @antvis. Using for chart generation and data analysis.
Skills
Explore the skills and capabilities of this skillset.
Configuration
Customize the skillset to fit your needs.
MCP Server
Connect to MCP Server
VIS_REQUEST_SERVER
MCP Server Chart
X/Twitter アシスタント
AI駆動のTwitterアシスタントで、コンテンツクリエイターがAI製品の体験をバイラルツイートに変換します。自動ポリッシュ、スマートリサーチ、ワンクリック投稿機能を備えています。
GitHub Issues アシスタント
GitHub Issues アシスタントは、GitHubのIssue管理を効率化するAIエージェントです。リポジトリ内でのバグ報告、タスク管理、機能リクエストの作成・追跡・優先順位付けをシンプルにします。チームでの利用に最適で、一貫したフォーマットを維持し、定型作業を自動化することで、開発プロセスをスムーズにします
ブランドデザイナー
スタートアップのデジタル製品向けに特別に設計されたブランドマーケティングAIアシスタントで、Product HuntやAppSumoなどのプラットフォームに適したオンラインプロモーション素材を迅速に生成し、ビジュアルクリエイティブ、プロモーションスローガン、ブランドトーン、セールスポイントのコミュニケーションをカバーします
MCP Server Chart

Lightweight CRM
Manage your startup or small business relationships efficiently with this Lightweight CRM template. Track sales activities, monitor client tracking and company contacts, automate workflows with CRM workflow automation, and generate insightful CRM reporting. Perfect for startups, small businesses, and teams looking for a streamlined CRM workflow solution to improve organization, sales, and customer management.

法的案件追跡と請求管理
このフォルダは、法的案件に関連するすべての情報を集中管理するためのもので、案件の進行状況、顧客とのコミュニケーション、及び関連する請求書や費用記録を含みます.


HR Knowledge Base
The HR Knowledge Base template provides team members with a clear view of HR knowledge, processes, and data. Access detailed policies, procedures, employee orientation guides, and resource links easily. Track updates with HR dashboards, visualize insights, and ensure regulatory compliance while supporting efficient HR workflow, reporting, and continuous learning across your organization.

週間タスクのスマートリマインダーと自動AI週間レポート
チームが週間タスクを効率的に管理するのに役立ちます。タスクの要約、進捗リマインダー、個人のサマリーレポートなど、一連の自動化ツールを通じて、チームメンバーはタスク情報と進捗状況を迅速に取得できるため、コラボレーション効率と作業透明性が向上します。これらの自動化機能を使用することで、チームは効率的な運用を維持し、各メンバーが自分のタスクについて明確な理解と責任感を持つことができます。

自动发送工资单
通过Bika.ai的自动发薪系统和工资单生成器,企业可实现工资单自动生成与批量发送,每月AI自动生成发薪报告与人工成本分析,高效精准提升HR和财务管理效率。

Event contacts management
Easily manage event contacts, track professional connections, and build your own personal CRM with this event CRM template. Log contact details, meeting notes, follow-up reminders, and attendee information all in one place. Ideal for networking events, conferences, and long-term relationship management. Boost your efficiency with an intuitive contact tracker and event workflow system.

Customer development CRM
Streamline your product development process with this Customer Development CRM template. Manage customer personas, track interviews, collect qualitative feedback, prioritize backlog items, and plan feature enhancements to drive meaningful product improvement. Perfect for startups, product teams, UX researchers, and agile teams looking to focus on what customers need most.
ローテーション勤務リマインダー(企業微信)
チームの当番スケジュールを効率的に管理し、当番情報の記録とリマインドを自動化し、各メンバーがタイムリーに当番通知を受け取れるようにします。例えば、ミーティング・ロスターのリマインダー、プロジェクト・ロスターの管理、オペレーションおよびメンテナンス・ロスターの管理などです。
MCP Server Chart
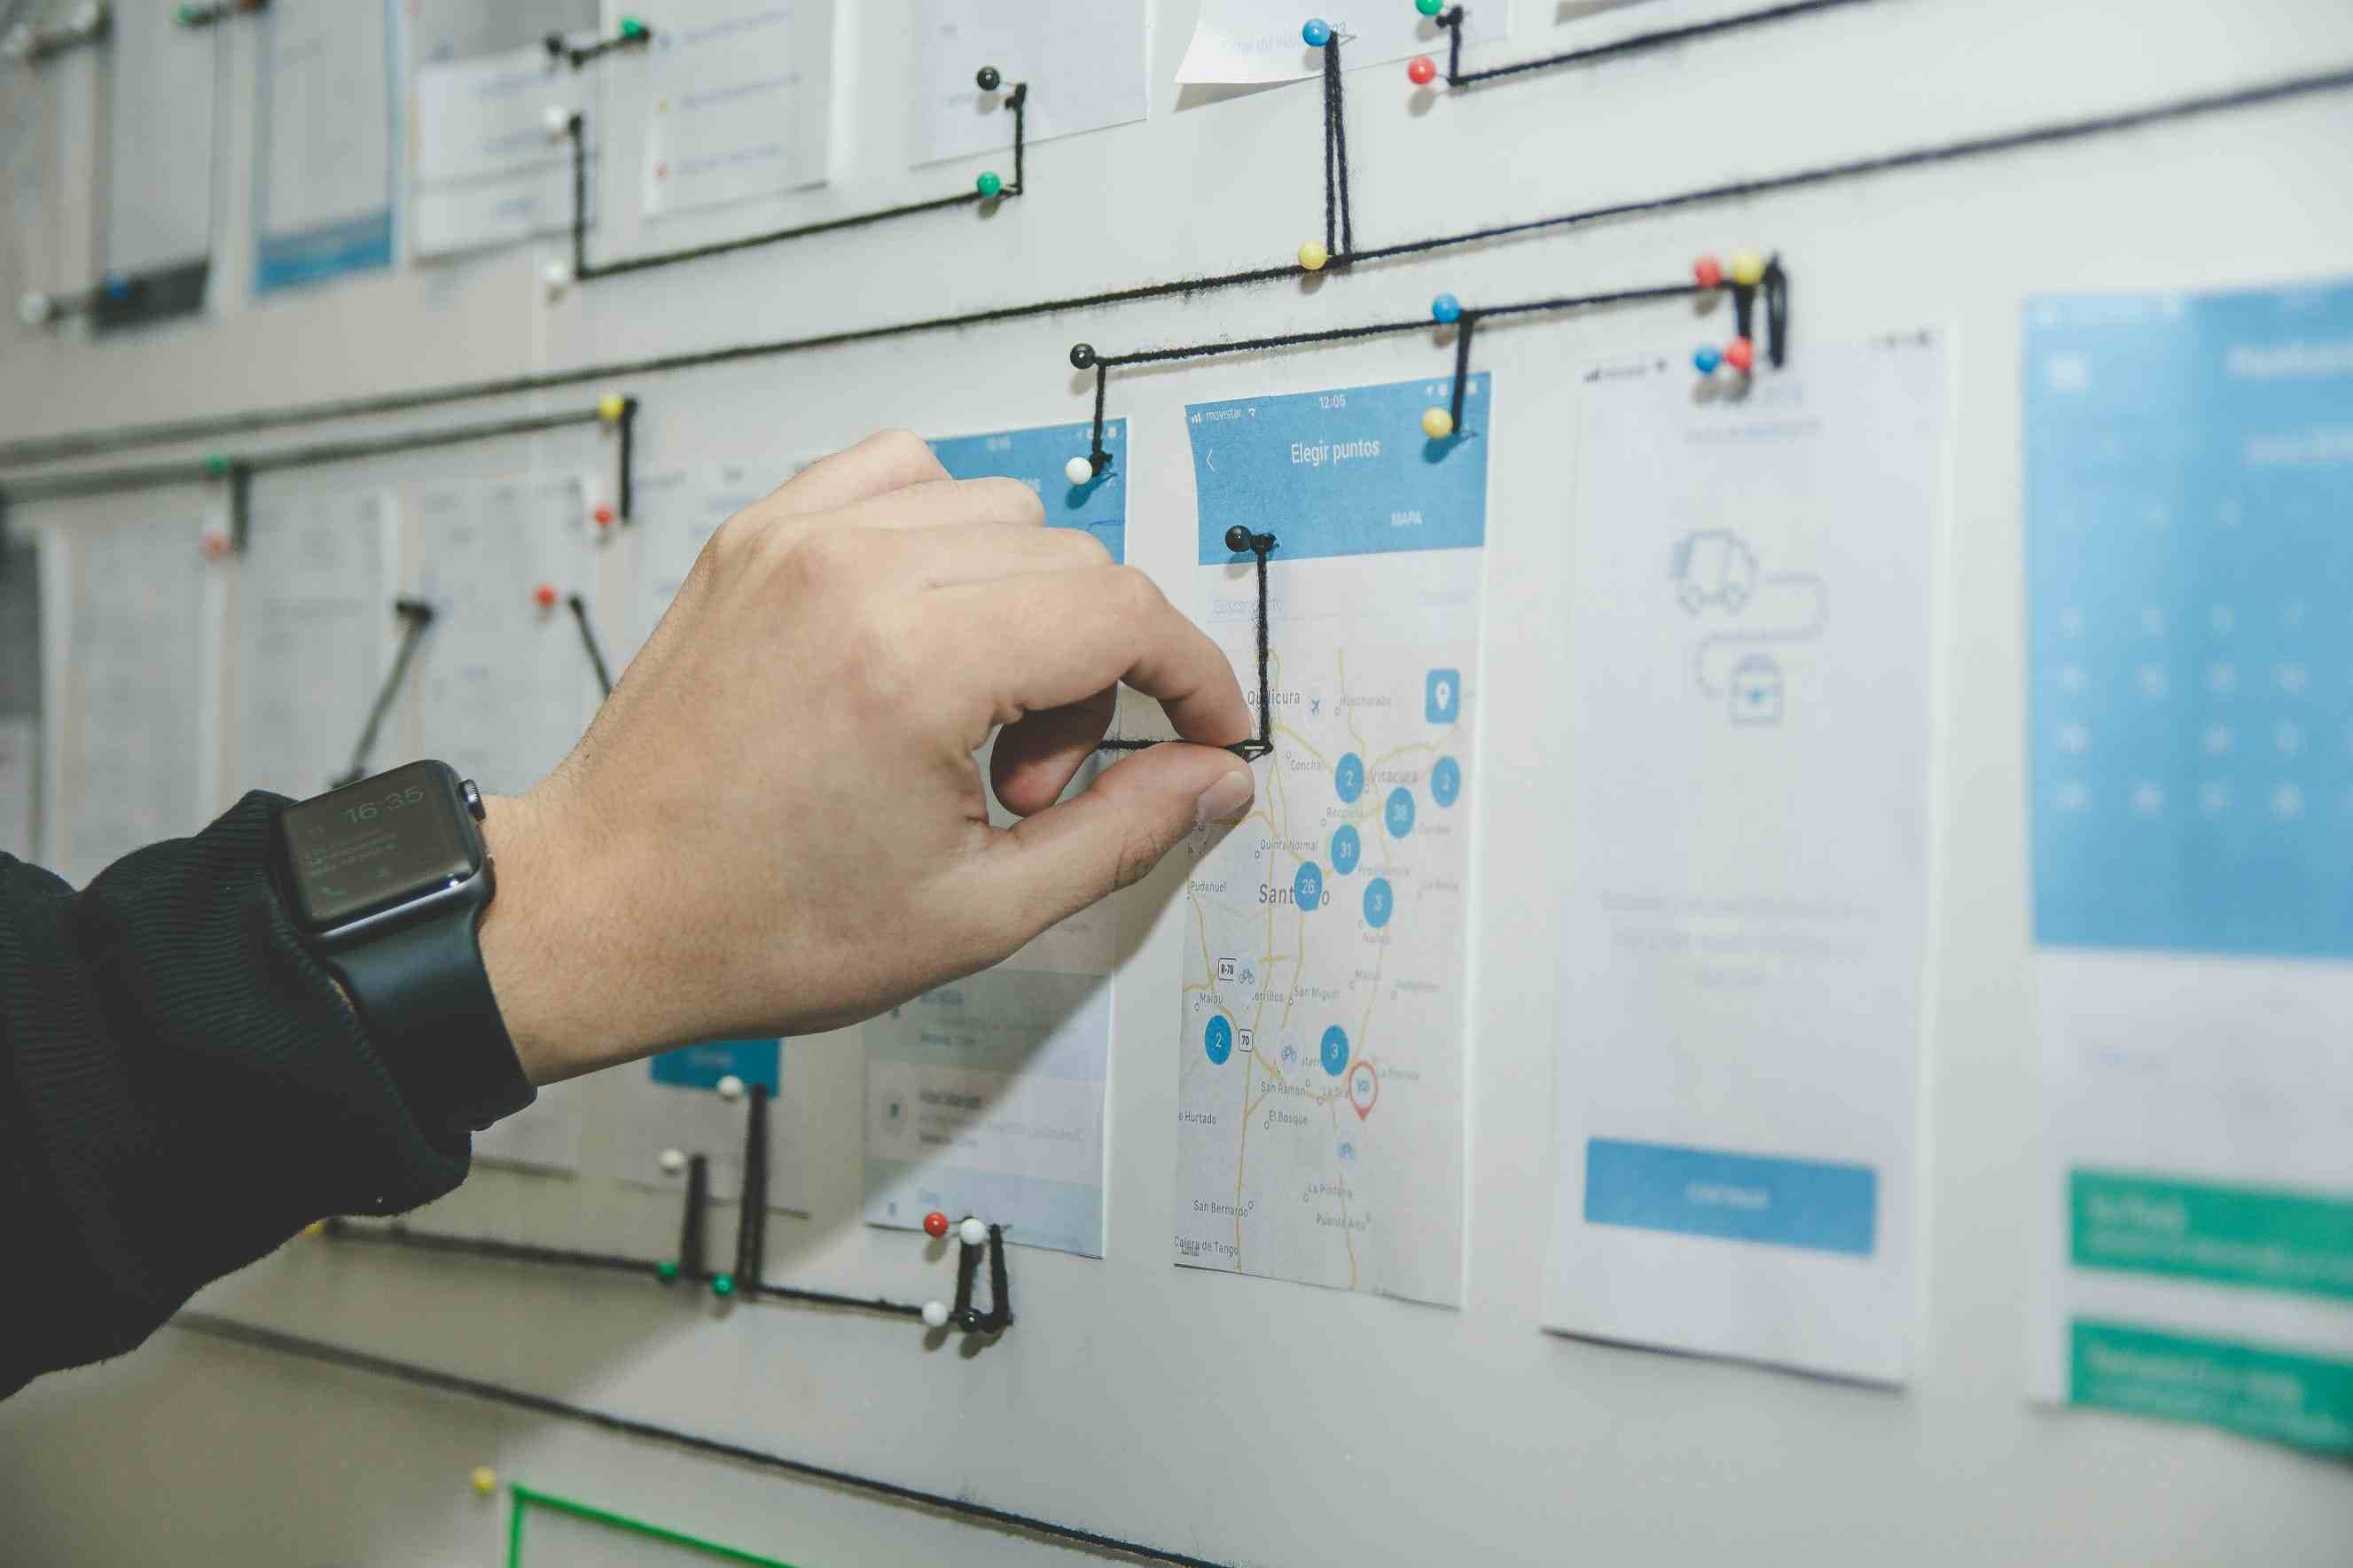
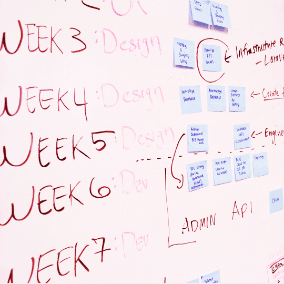
Project planning
Create organized project reports and overviews with this Project Planning Dashboard Template. Track project progress, monitor performance, analyze efficiency, and manage team tasks—all in one structured project setup tool.

毎週の会議リマインダー (Slack)
このテンプレートを使用すると、Bika.ai は週次チーム会議の前に Slack を介してリマインダーを送信し、時間、場所、議題を含めます。さらに、Bika を活用することで、より多くのインスタントメッセージングプラットフォームや通知方法に拡張し、チームメンバーが時間通りに参加し、会議が円滑に進行することを確認できます。

项目进度管理
通过集中管理项目和任务完成进度和执行情况,利用自动化功能跟进项目任务状态,有助于提高项目管理和任务协作的效率。

AI 増値税発票情報認識(中国)
本テンプレートは、百度スマートクラウドの財務認識OCRを利用して、発票の重要な情報を自動的に抽出し、発票の真偽確認をサポートします。企業や個人が手動入力を減らし、財務データ管理の効率を向上させるのに役立ちます。作業プロセスを最適化し、人為的なエラーを減らし、データの正確性を向上させます。

B2B顧客管理と販売追跡
AI は顧客を自動的に管理し、あなたまたは営業チームに毎週訪問記録を書き留めるよう促します。これは、企業組織と対峙する B2B 営業チームに適しています。


Product/market fit system
Streamline your product/market fit process with this comprehensive template. Collect and manage user feedback, track feature requests, analyze survey responses, and gain actionable product insights to drive improvement. Centralize feedback data, monitor performance, and prioritize features with a feedback dashboard and database designed for founders, managers, and product teams.
Business Contract Management
The challenges in traditional contract management, such as dispersed information, difficulty in tracking, repetitive data entry, and lack of transparency in status, have been addressed. This effectively helps teams efficiently manage the contract lifecycle, reduces manual operations, and improves data accuracy and team collaboration efficiency