MCP Excel Server
Enables Excel file operations and data analysis with tools for statistical analysis, data filtering, pivot table creation, and visualization through charts and plots.
Skills
Explore the skills and capabilities of this skillset.
Configuration
Customize the skillset to fit your needs.
MCP Server
Connect to MCP Server
MCP Excel Server
X/Twitter 助手
X/Twitter 助手是一款 AI 驱动的推特助手和推文助手,帮助内容创作者将 AI 产品体验转化为病毒式推文。具备自动润色、智能研究与一键发布功能,是你的 X/营销助手利器,让推文更高互动、更易触达受众。
Github issues 助手
Github Issues 助手是一个 AI 智能体,用于简化 GitHub issues的管理。它可以直接在存储库中简化创建、跟踪和优先处理错误、任务或功能请求的过程。非常适合团队使用,确保一致的格式,自动化重复步骤,并与开发管道集成。
MCP Excel Server

User Story Mapping
Enhance product planning and agile workflows with the User Story Mapping template — designed for team alignment, backlog management, and collaborative workflow optimization. Visualize the user journey, apply feature mapping, and leverage a prioritization tool to identify and prioritize features based on development priorities and customer feedback. Perfect for product iteration cycles and visual organization of complex projects, enabling development teams to streamline processes, improve communication, and deliver high-value features faster.

Program Communications Plan
Build a strong communication strategy with our Program Communications Plan Template. Perfect for project communications, stakeholder engagement, audience management, and program strategy, it provides a structured framework for communication workflow, key messages, activities, scheduling, and tracking.
社区活动分析员
分析社区活动截图,报告参与趋势和讨论亮点。上传社区互动的截图,该智能体会生成一份清晰的markdown报告,总结参与水平、关键讨论主题和显著亮点 — 非常适合社区经理、市场营销人员和产品团队。
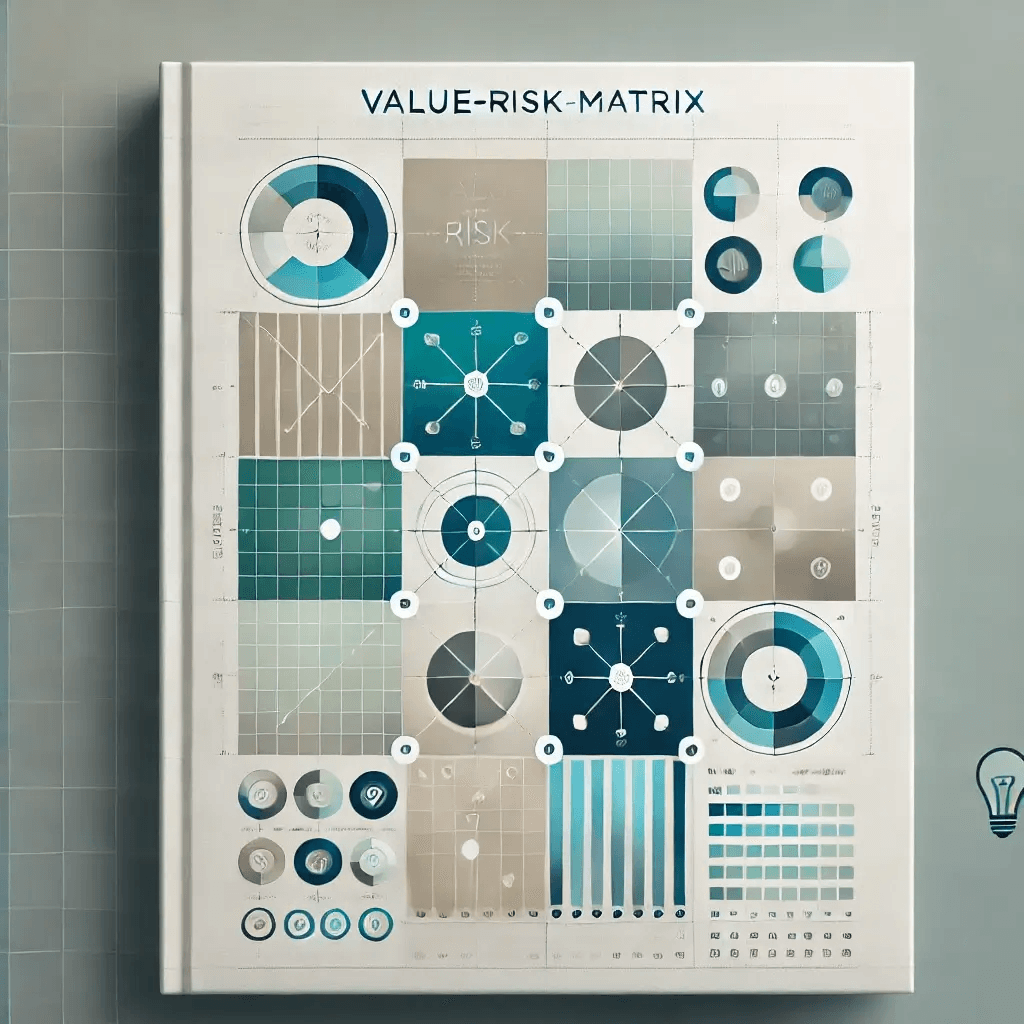
Value-Risk Matrix
Prioritize tasks effectively with the Value-Risk Matrix template — a powerful tool for value assessment and risk-based decision-making. Manage high value tasks with automated notifications, streamline task grouping, and enhance management efficiency through automation integration. Monitor priority levels, send real-time team notifications, and use the task database to track process changes and detailed task descriptions. Perfect for project managers and team leads aiming to focus on critical priorities and improve workflow speed.


邮件转工单(AI自动化)
「邮件转工单(AI自动化)」作为一种自动化解决方案,用于实时监测邮箱中的客户邮件、将其智能转换为工单、将邮件内容同步至客户帮助系统、并自动分配处理人,帮助团队自动收集和整理客户反馈,确保所有客户问题得到及时跟踪和响应。

AI批量图片识别(DeepSeek-vl2)
Bika.ai 集成 DeepSeek-vl2,实现 AI 批量图片全自动化识别。上传图片后,系统即可自动完成图片内容分析和信息记录,无需手动操作,快速高效。

A Simple & Powerful CRM
Boost your business with A Simple & Powerful CRM — a complete CRM template and toolkit for managing clients, tracking sales and leads, recording meetings, and optimizing your CRM workflow. Access a visual dashboard for sales tracking, maintain detailed client info in the CRM database, close deals faster, and streamline customer journeys with integrated visit records and onboarding forms.

关系关怀
记录您的人际关系及与他们展开的活动,系统自动提前提醒并发送生日祝福,每周关怀活动通过AI智能总结,确保您不错过每一个重要时刻。
MCP Excel Server


Event contacts management
Easily manage event contacts, track professional connections, and build your own personal CRM with this event CRM template. Log contact details, meeting notes, follow-up reminders, and attendee information all in one place. Ideal for networking events, conferences, and long-term relationship management. Boost your efficiency with an intuitive contact tracker and event workflow system.

Product Messaging Library
The Product Messaging Library Template centralizes your messaging guidelines, ensuring consistent messaging across marketing and technical content. Organize internal documentation, maintain content consistency, follow copywriting guidelines, and streamline your content team workflow with this easy-to-use messaging template and tone guide. Perfect for teams aiming for a unified brand voice and messaging best practices.


潜在客户管理:自动通知与AI驱动策略
当有新的客户通过表单提交相关资料时,通过预设的触发条件和自动化操作,智能执行与新线索管理相关的各项任务(包含AI自动提供跟进建议),帮助销售与客户服务团队高效获取线索、及时响应并推动后续跟进。


每周例会提醒(Slack)
使用这个模板,Bika.ai 可以在每周例会开始前,通过 Slack 发送提醒,包含时间、地点和议程安排。此外,借助 Bika,你还可以扩展到更多 IM 平台或消息通知方式,确保团队成员准时参加并顺利开展会议。

Visual inspiration tracking with web clipper
Capture and organize creative inspiration with the Visual Inspiration Tracking with Web Clipper template. Store and categorize visual assets, logo collections, idea library entries, and web screenshots with easy tagging using asset tags. Perfect for designers, artists, and creative teams, this customizable tool lets you add fields, tag assets, and maintain organized asset records. Enhance your visual workflow and ensure every piece of inspiration is preserved and ready for your next project.
Scrum Sprint Task Management Automation
Streamline your Scrum sprints with this powerful automation template. Effortlessly track progress, manage sprint tasks, assign tasks, resolve issues, and send automated notifications. Keep your team aligned with real-time project updates, workflow tracking, and a comprehensive sprint dashboard for timely delivery of sprint goals.