Guide
Basic
Automation Guide
Database
Dashboard
Integration Guide
Self-hosted
Open API
Business AI Agent Template
Cookbook
Reference
Automation Triggers
Automation Actions
Integrations
Node Resources
Database Views
Database Fields
Dashboard Widgets
Missions
Ai Wizard
Formula
Space
Videos
Release Notes

Pivot table widget

The pivot table widget is one of the core functions in data analysis tools. It supports multi-dimensional grouping and flexible summarization to quickly generate structured statistical reports. Whether it's sales data statistics, inventory analysis, or operational indicator monitoring, data aggregation calculations (such as summation, average, maximum value, minimum value, etc.) can be achieved through simple configuration and displayed in an intuitive cross-tabular form.

Core Functions

  1. Multi-dimensional grouping: Support grouping data by row dimension (Row) and column dimension (Column)
  2. Diverse statistics: Provide multiple aggregation methods such as sum (Sum), average (Average), maximum value (Max), and minimum value (Min).

Usage steps

  1. Create a dashboard

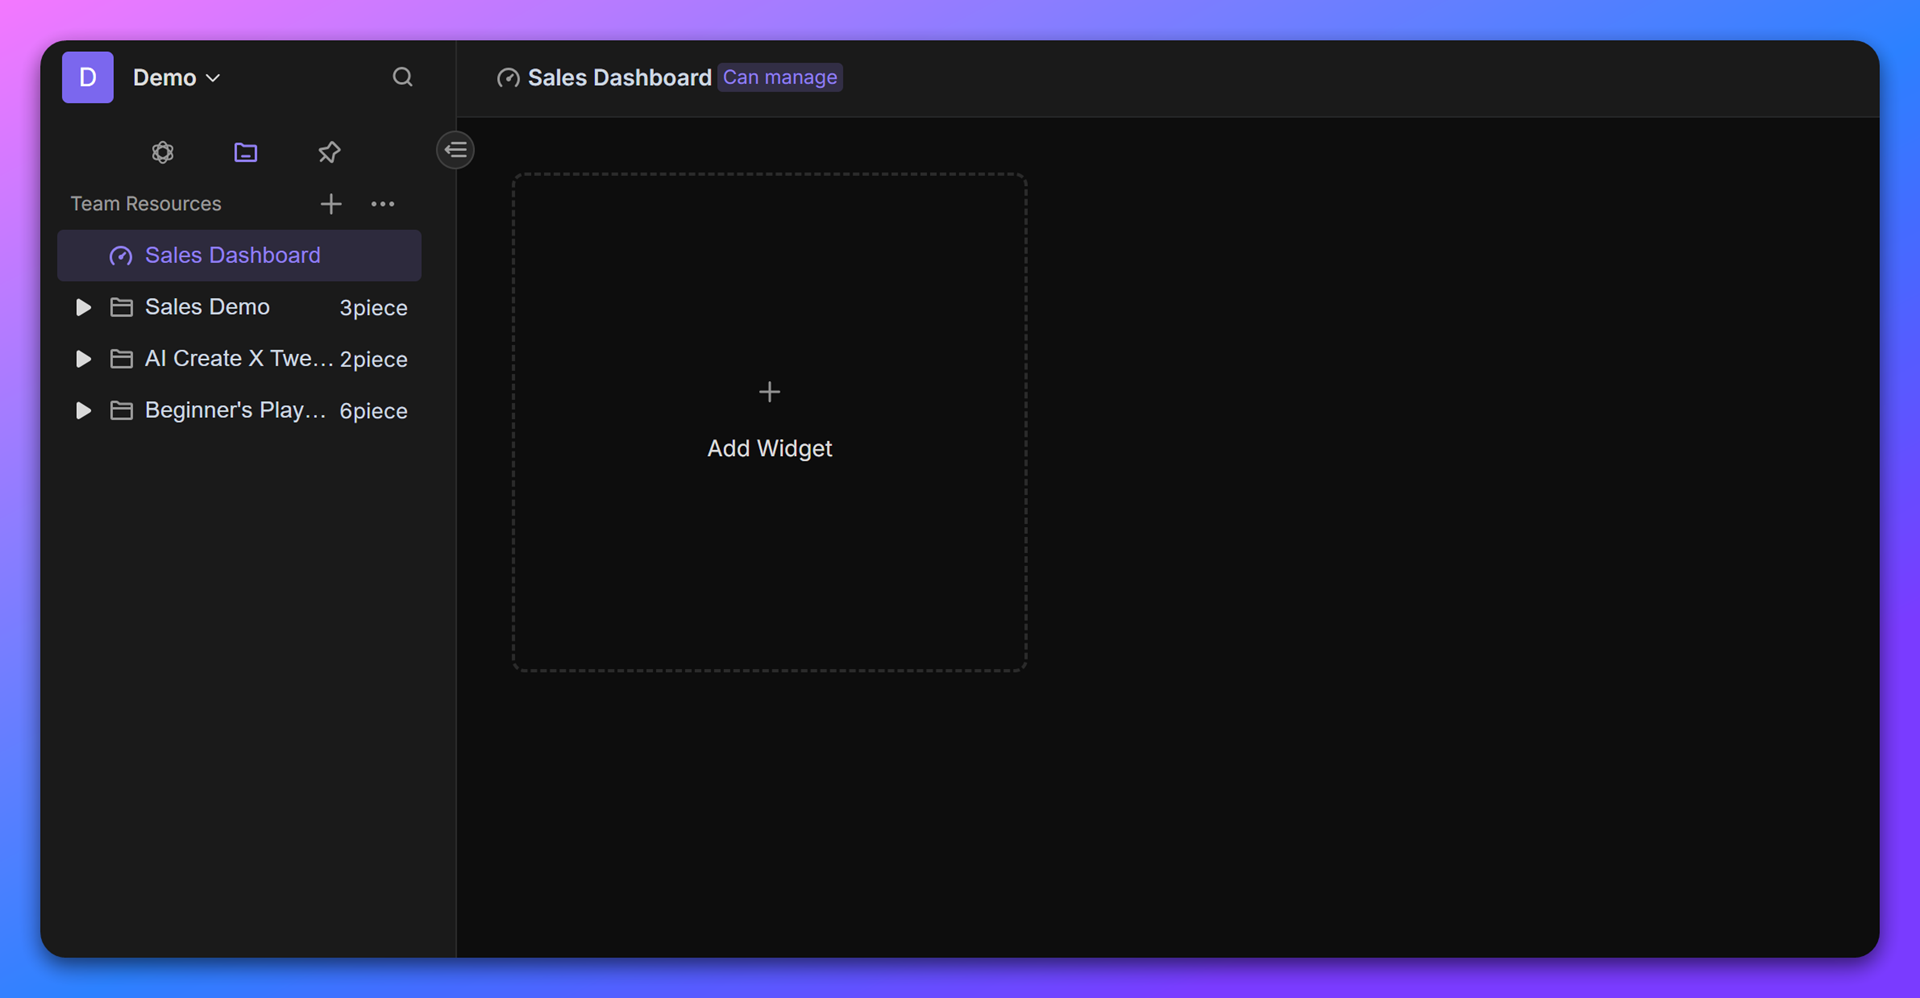
Enter the space and create a new dashboard. Click "+ Add widget" in the toolbar and select "Pivot table".

  1. Configure data source
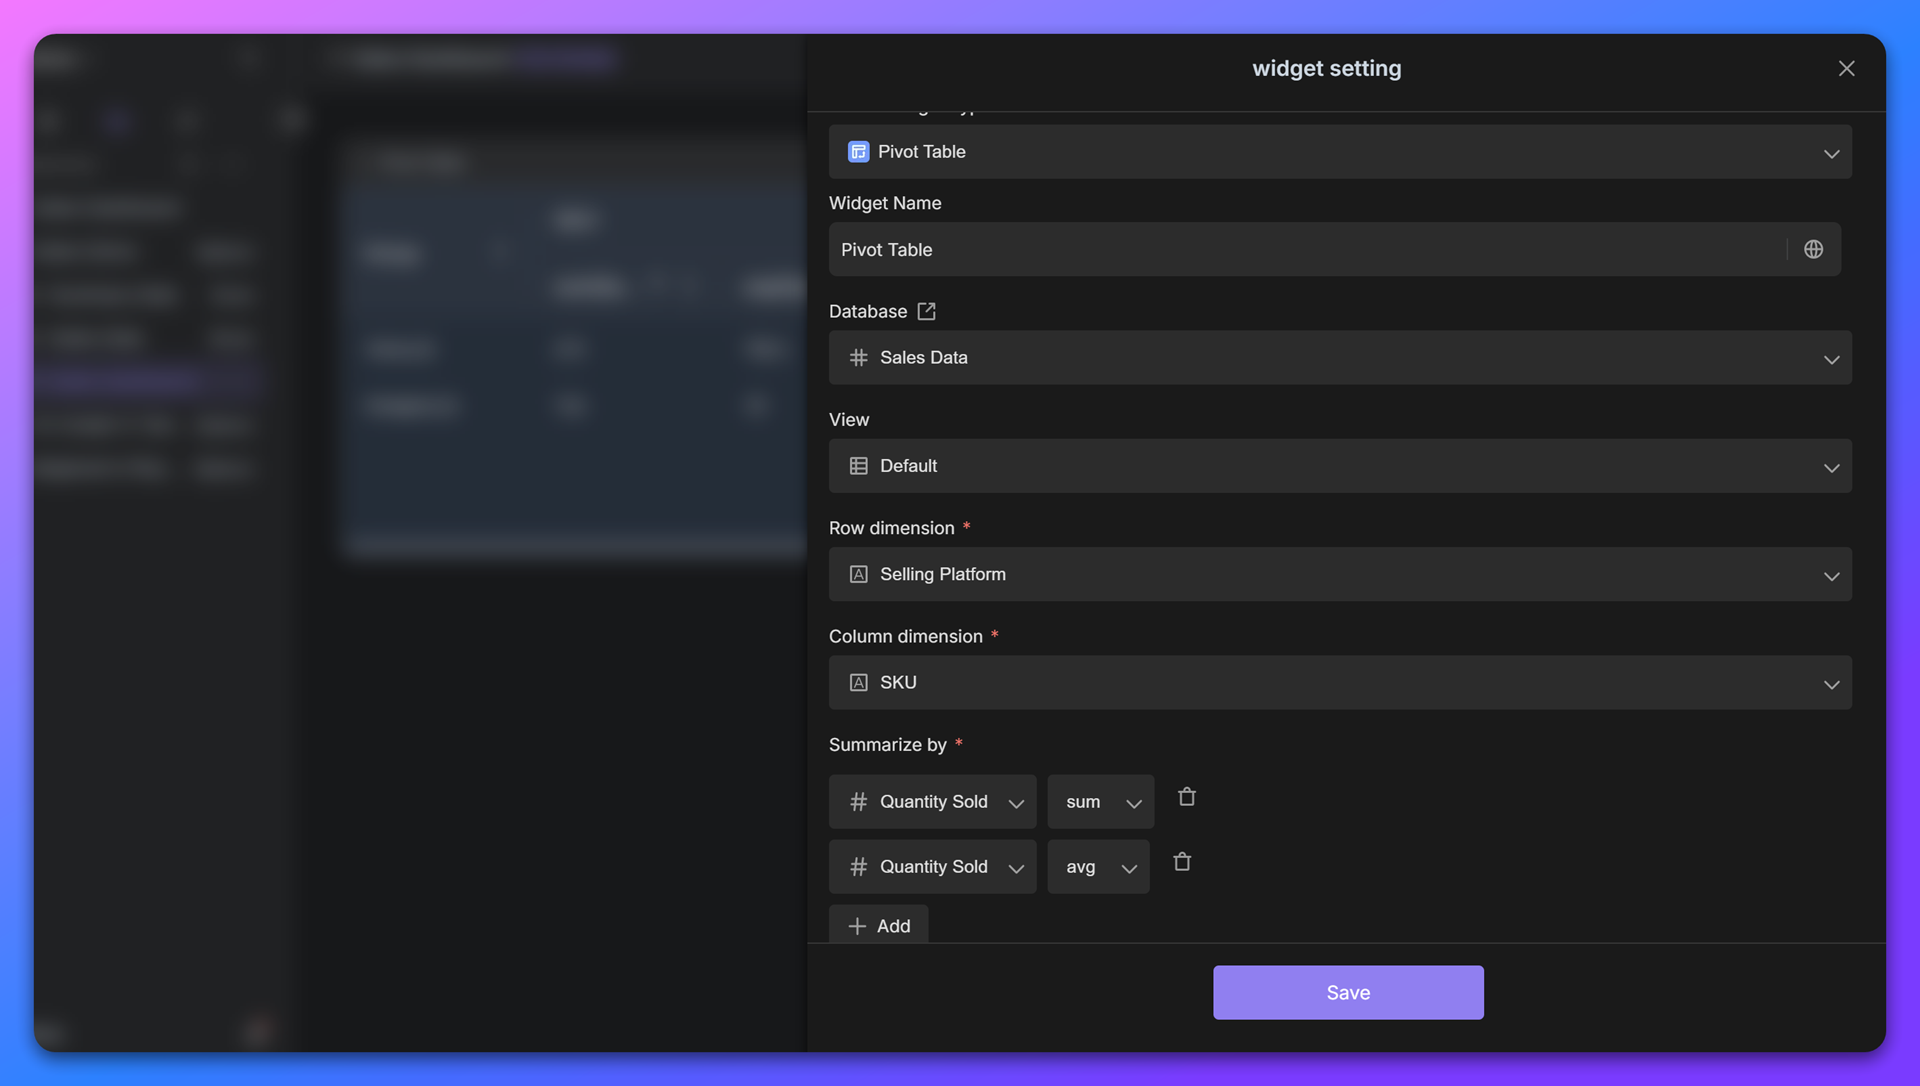
  • In the widget configuration interface, specify the database (Database) and data view (View) that need to be analyzed.
  1. Set row and column dimensions
  • Row Dimension: Usually, a first-level classification field (such as "sales platform") is placed. Data will be grouped vertically according to this field.
  • Column Dimension: Usually, a second-level classification field (such as "SKU") is placed. Data will be grouped horizontally according to this field.

Example: If you need to view the sales situation of each "SKU" by "sales platform", then:

  • Row Dimension: sales platform
  • Column Dimension: SKU
  1. Add summary indicators

In "Summary by", configure the numerical fields and statistical methods that need to be calculated:

  • Click "+ Add" and select the target numerical field (such as "sales volume").
  • Set the statistical method:
    • Sum: summation
    • Average: average
    • Max: maximum
    • Min: minimum

Example: If you need to count the total sales volume of each SKU under each platform, then add the indicator: Quantity SoldSum

  1. Generate and save

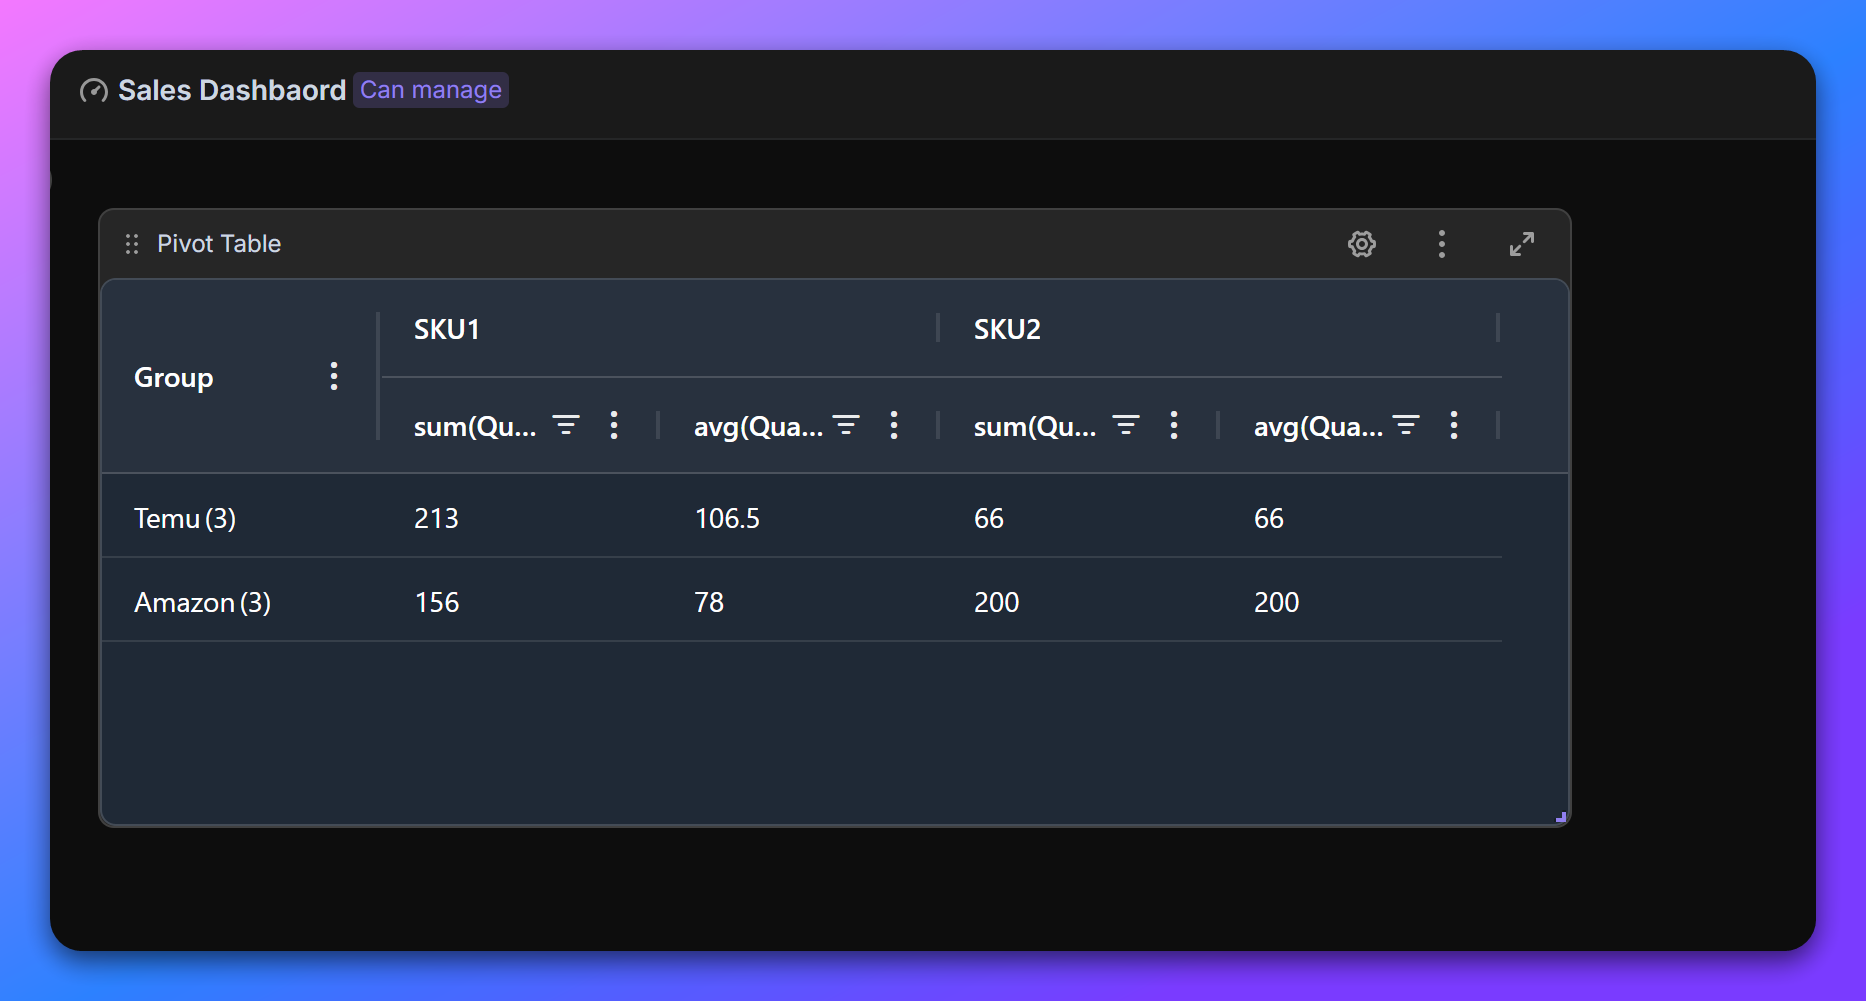
After completing the configuration, click "Save" and the system will automatically generate a pivot table. The report will display data in a cross form. For example:

  • Each row represents a sales platform, each column represents an SKU, and the corresponding summary value (such as total sales volume) is displayed in the cell.

Application scenario example

Sales data statistics

Suppose the original data contains:

  • Row dimension: sales platforms (Temu, Amazon, TikTok)
  • Column dimension: SKU (Product A, Product B, Product C)
  • Summary indicator: quantity sold (summed)

After configuration is completed, the pivot table will present the following structure:

Sales platform \ SKU

Product A

Product B

Product C

Temu

150

200

120

Amazon

90

180

75

Tiktok

210

150

95

Advanced skills

  • Multiple indicator overlay: Add the same field repeatedly in "Summary by" and select different statistical methods (such as calculating "total sales volume" and "average sales volume" simultaneously).
  • Dimension adjustment: If more detailed analysis is needed, multi-level row/column dimensions can be added (for example, "sales platform" + "region").
  • Sorting and filtering: Click on the table header to sort the data, or focus on key information through the filter on the right.
bika cta

Recommend Reading

Recommend AI Automation Templates

HR Knowledge Base
HR Knowledge Base offers team members clear views of policies, processes, and benefits. With easy access to detailed information and links, it keeps HR data updated, promoting learning and regulatory compliance.
Recruitment Template
A template for the recruitment process that can collect candidate information and remind candidates of their progress daily.

Coming soon

HR Team Project Tracker
Monitoring staff programs, spontaneous client requests, and strategic initiatives can be difficult in expanding teams. Centralize your projects and tasks to improve teamwork and control.
IMAP Customer Service Record Automation
The IMAP email listening service template is specifically designed for customer service and sales teams, aiming to automate the capture and real-time recording of customer emails into the customer service records. This process not only enhances the tracking efficiency of customer interactions but also ensures zero omissions in customer feedback. Additionally, the template can detail each customer service representative's responses to customer emails and generate regular reports, providing the team with a clear overview of their work.
Email-to-Task Automation for Support Teams
The Email-to-Task Automation for Support Teams template is a cutting-edge solution designed to monitor customer emails in the support inbox in real-time and convert them into ticket tasks. It also automatically rotates the assignment of follow-up personnel. This template assists teams in automatically gathering and organizing customer feedback, ensuring that all customer issues are promptly tracked and responded to, thereby enhancing the efficiency and quality of customer service.
Information Query (Student Grades)
This template is used for querying information data and providing feedback on query results via email. It ensures information isolation while allowing external users to easily retrieve the required information. In addition to exam result queries, it can also be used for use case such as competition registration results and bid results, ensuring efficient responses and accurate retrieval of necessary information.