OKR Tracker & Quarterly Report Automation
v1.0.4
Bear
Streamline your goal management and team performance tracking with the OKR Tracker & Quarterly Report Automation template. Automate OKR reporting, monitor progress through the OKR dashboard, generate quarterly performance reviews, and keep your team aligned with real-time work progress tracking and automated reports. Perfect for team leaders, project managers, and enterprises aiming to improve efficiency and achieve objectives seamlessly.
📋 Project Management
Included Resources
OKRs - Participants
Objectives
KeyResults
Quarterly Report Automation
OKR Dashboard
Workflow Graph
Workflow Graph
Workflow of OKR Tracker & Quarterly Report Automation
💡 OKR Tracker & Quarterly Report Automation
In today's fast - paced work environment, automation can significantly improve efficiency, reduce repetitive tasks, and enable you to focus on more strategic tasks. Bika.ai's automation templates aim to streamline processes and manage your OKRs (Objectives and Key Results) through intelligent means.
👉 How the Template Works
-
OKR - Participants Used to record the names, positions, teams, and goal tasks of team members to quickly understand each member's role and responsibilities.
-
Objectives When filling out this table, each goal must have an assigned responsible person, role, team, deadline, and current completion rate, along with specific key results to measure progress.
-
KeyResults For each goal, specify the key results, responsible person, responsibilities, team, expected completion time, as well as confidence level and actual completion percentage. This allows you to easily manage and track the progress of goals.
-
Quarterly Report Automation This automation simplifies the OKR quarterly summary by automatically executing "send report on the last day of each quarter," improving efficiency for businesses that require regular updates and insights.
-
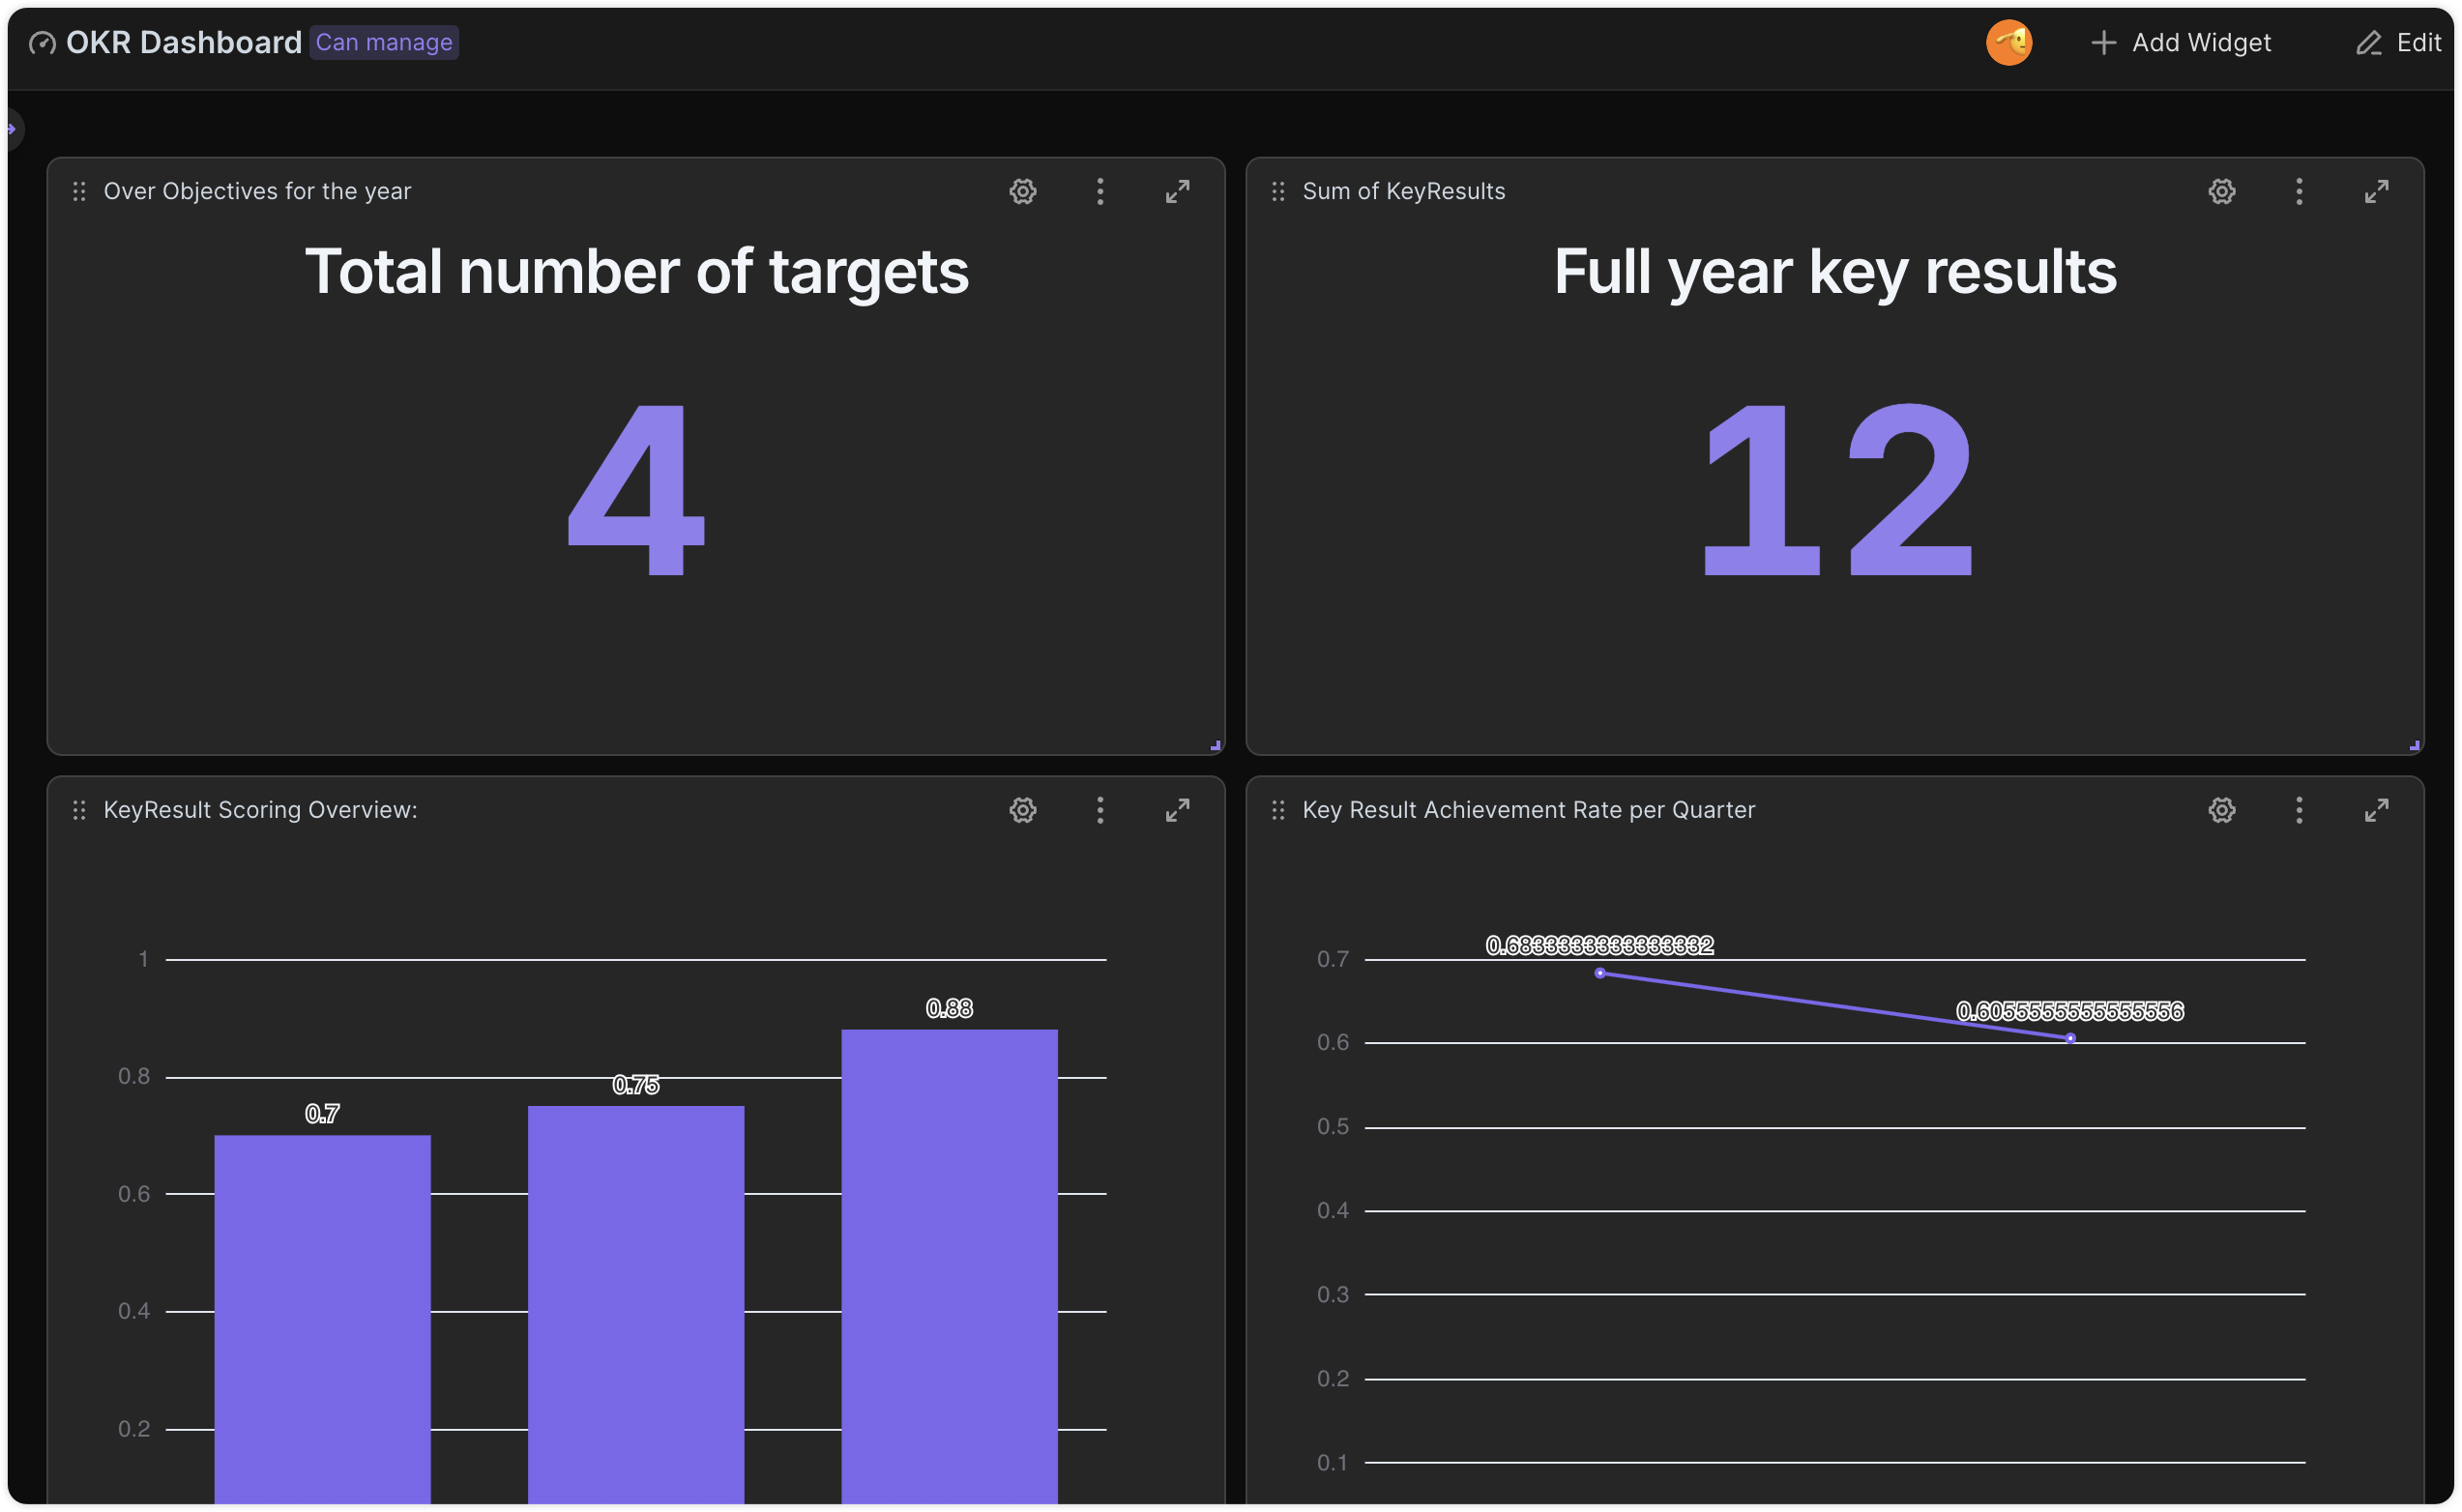
OKR Dashboard The OKR dashboard helps track and visualize key performance indicators such as the total number of goals and key results, promoting goal management and progress monitoring to improve business planning.
🎯 Steps to Use
Step 1: Add OKR Participants
-
First, configure the names of the OKR participants, select their roles, and choose the teams they belong to.

-
The columns for objectives and key results can be set aside for now.
Step 2: Set Objectives
-
In the objective table, you need to fill in the objectives and time, and associate the responsible persons and key results. Generate views classified by time, with Q1 and Q2 as the classification categories.

Step 3: Determine Key Results
-
Then go to the key results table: Fill in the corresponding key results, confidence index, completion rate, and KR score according to the objective situation.

Step 4: Configure Quarterly Report Automation
-
In the timing settings, configure the repetition frequency as monthly and the repetition interval as 3, which can realize the automatic sending at the end of each quarter. The original template is set to send reports quarterly. If you have requirements, you can also modify the triggering time according to the actual situation.

-
The recipients can be configured according to the actual situation.

-
After clicking "Run Now", the configured email will receive the report as shown in the example image.

Step 5: Use the OKR Dashboard to Monitor Progress
-
You can observe the data changes of objectives and key results more intuitively through the dashboard. You can also add or delete widgets according to your actual needs.
👉 Suitable Users
- Team leader: A leader who needs to manage team goals and progress.
- Project manager: A project manager responsible for project progress and team collaboration.
- Enterprise employee: An enterprise employee who wants to improve personal work efficiency.
- Consultant: A consultant who provides OKR implementation and consulting services to enterprises.
FAQ
1. What is the difference between an Objective and a Key Result?
An Objective (O) is a qualitative statement of what you want to achieve (e.g., "Become the market leader in the CRM sector"). A Key Result (KR) is a quantitative metric used to measure progress toward that objective (e.g., "Acquire 50 new enterprise clients by the end of Q1").
2. How is the "Objective Completion Rate" calculated?
The template typically uses a rollup or formula field. It automatically averages the Completion Percentage of all the Key Results linked to a specific objective. As you update your KRs, the status of the main Objective updates in real-time.
3. Can I change the report frequency from Quarterly to Monthly?
Yes.
- Go to the Automation tab and select the Quarterly Report Automation.
- Click on the "Scheduled Trigger" node.
- Change the repetition interval from "3 months" to "1 month".
- Update the email subject line to reflect that it is now a "Monthly Progress Report."
4. What does the "Confidence Level" field mean?
The Confidence Level is a subjective score (usually 1–10 or 10%–100%) indicating how likely the owner believes they are to achieve the KR.
- High (7-10): On track, no major blockers.
- Low (1-3): At risk, requires immediate attention or additional resources.
5. How do I share the Dashboard with stakeholders who don't use Bika?
- Open the OKR Dashboard.
- Click the "Share" button in the top right.
- Enable "Public Link" or "Embed".
- Stakeholders can then view the charts and progress bars in their browser without needing a Bika account.